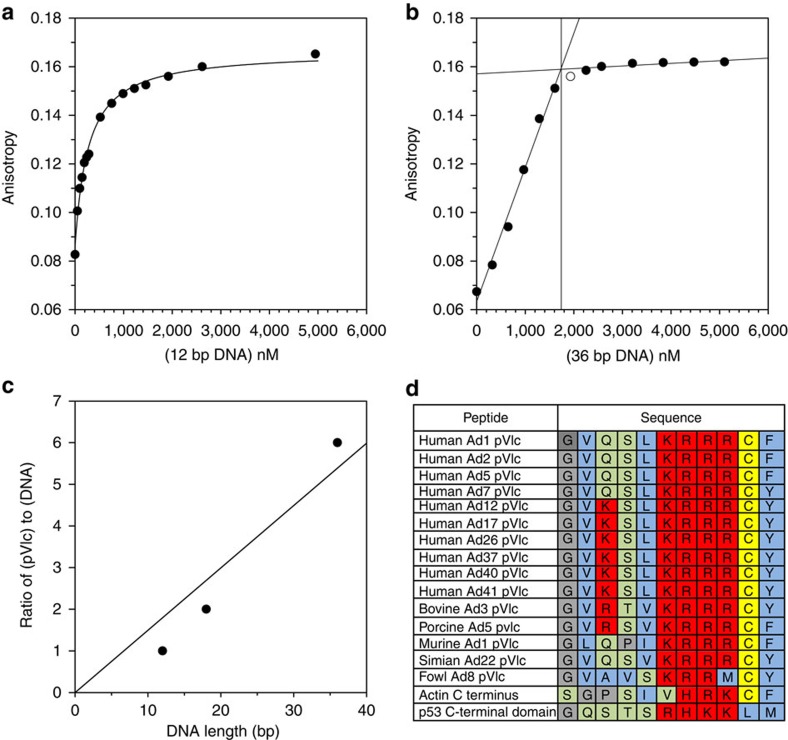
Figure 1. Binding of pVIc to DNA.
(a) The equilibrium dissociation constant, Kd(app.) for the binding of pVIc to DNA was determined by incubating 10 nM Cy3B-pVIc with increasing amounts of 12-mer dsDNA and measuring the change in anisotropy. The experiment was repeated five times. The line through the closed circles represents the nonlinear regression fit of the experimental data to a 1:1 ligand–receptor model. The Kd(app.) was 264±25 nM (ref. 14). (b) The stoichiometry of binding of pVIc to DNA was determined by incubating 10 nM Cy3B-pVIc and 10 μM pVIc with increasing amounts of 36-mer dsDNA and measuring the change in anisotropy. The two straight lines were drawn using the data in the filled-in circles. The point with the open circle was not included in the fits for the lines. The intersection point of the two lines is the minimal concentration of DNA required to saturate 10 μM pVIc; it indicates six molecules of pVIc saturate one molecule of 36-mer dsDNA. (c) The number of base pairs of DNA occluded by the binding of one pVIc to DNA. The experiment in b was repeated but with 12-mer and with 18-mer dsDNA, and the stoichiometries of binding plotted versus the DNA length in base pairs. The line indicates that one molecule of pVIc occupies 6.6 bp of dsDNA. (d) Amino-acid sequences of pVIcs from various adenoviruses, the last eight amino acids of β-actin and NLSIII from the p53 protein. Basic amino acids are coloured in bright red, hydrophobic in blue, polar in light green, cysteine in light yellow, and glycine and proline in light grey.

