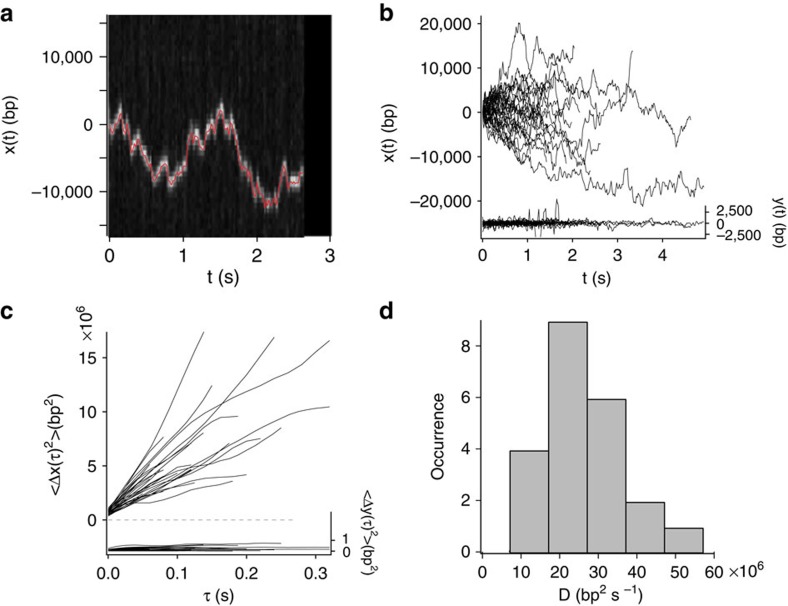
Figure 2. One-dimensional diffusion of pVIc along DNA.
(a) Rapid motion of a pVIc molecule along flow-stretched dsDNA recorded at 50 frames per second. The kymograph was generated from raw images showing motion along DNA (each vertical strip of pixels is taken from one movie frame) as a function of time (horizontal axis). The red line represents the position estimate in each frame determined using Gaussian centroid determination. (b) Diffusion of pVIc along flow-stretched dsDNA. The 11-amino acid peptide pVIc diffuses rapidly along DNA (x(t), left axis, 35 trajectories). (c) MSD of the trajectories shown in b along the DNA (<Δx(τ)2>, left axis). (d) Histogram of the diffusion constants for pVIc diffusing along dsDNA. The initial slopes of the MSD of each of the 35 trajectories from pVIc molecules sliding on DNA plotted in c were used to calculate one-dimensional diffusion constants (D1) according to D1=<Δx2>/2Δτ. The results are displayed in the histogram; the mean was equal to 26.0 × 10⁶ (bp)2 s−1 (ref. 14). In b and c motion transverse to the DNA (y(t) and <Δy(τ)2>, respectively, right axes) is represented on the same scale, as a control.

