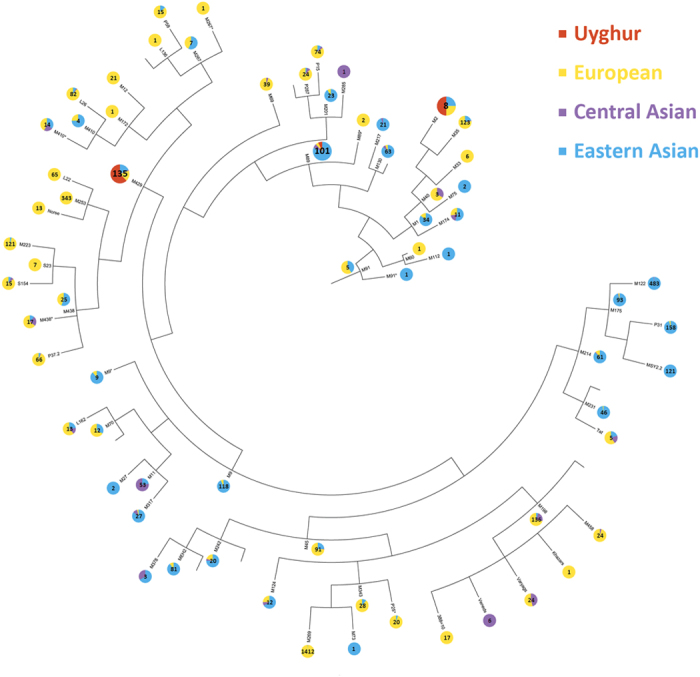
Figure 3. Y-DNA haplogroup tree of Uyghur, European, Central Asian and Eastern Asian samples.

The number in each pie chart reflected the total number of samples in each haplogroup.

The number in each pie chart reflected the total number of samples in each haplogroup.