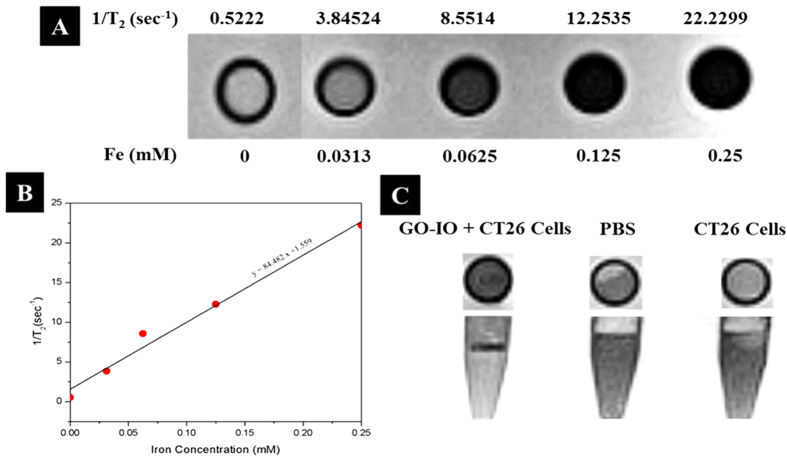
Figure 4.
(A) T2 -weighted MR images of the GO-IO-PEG nanocomposites for various Fe concentrations, (B) Plot of the T2 relaxation rate (1/T 2) against various iron concentrations of the GO-IO-PEG nanocomposites (relaxivity measurement of GO-IO-PEG nanocomposite by linear correlation between the relaxation rate 1/T2 and the iron concentration), (C) MR phantom imaging of CT26 cells with GO-IO-PEG nanocomposite.

