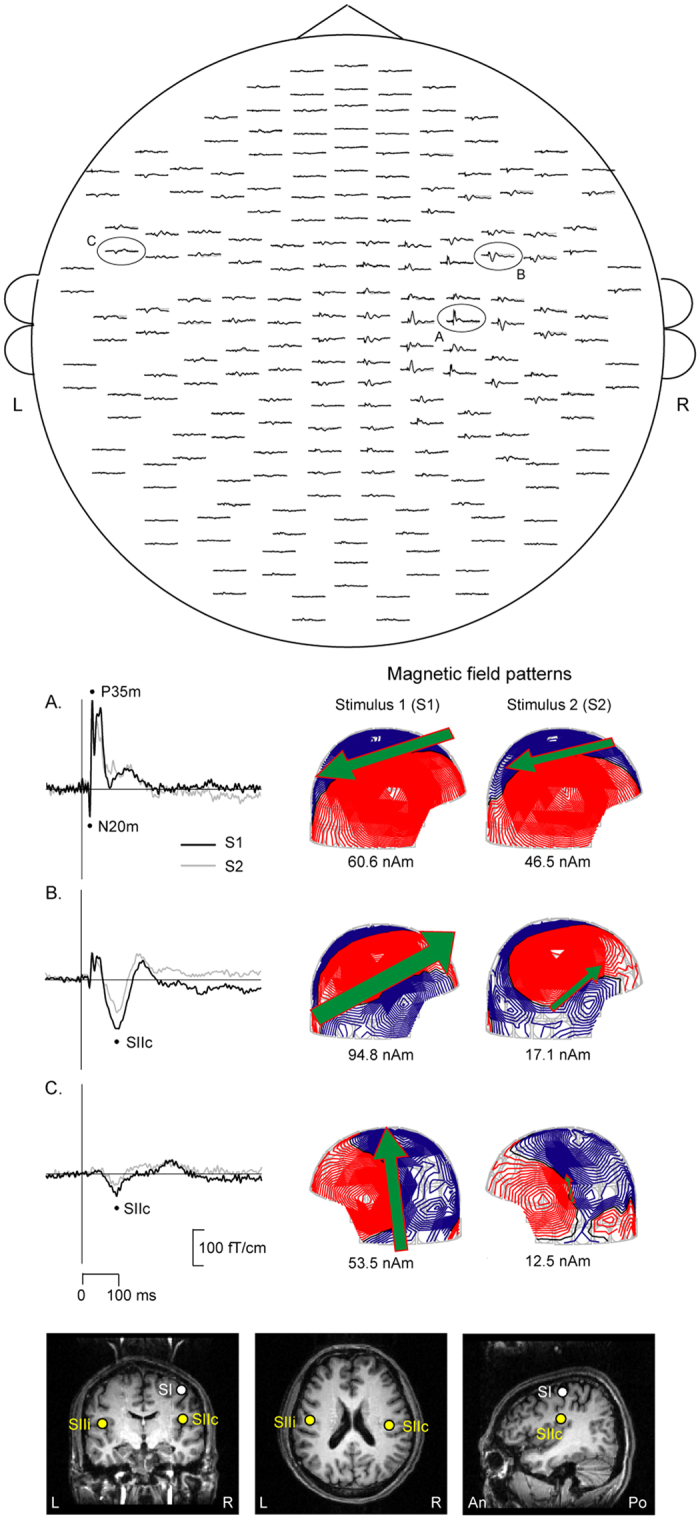
Figure 1. MEG signals for the paired-pulse electrical stimulation on the left median nerve in one representative subject.

Upper panel: Spatial distribution of somatosensory evoked fields (SEFs) over 204 planar coils, viewed from the top of the head. Middle panel: The enlarged inserts from the encircled channels illustrate the magnetic field patterns at the peak latencies of the primary somatosensory cortex (P35m of SI, A), contralateral (SIIc, B) and ipasilateral (SIIi, C) secondary somatosensory cortex. Lower panel: The location of SEFs to Stimulus 1 on the MRI scans of the subject. R, right, L, left, An, anterior, Po, posterior.
