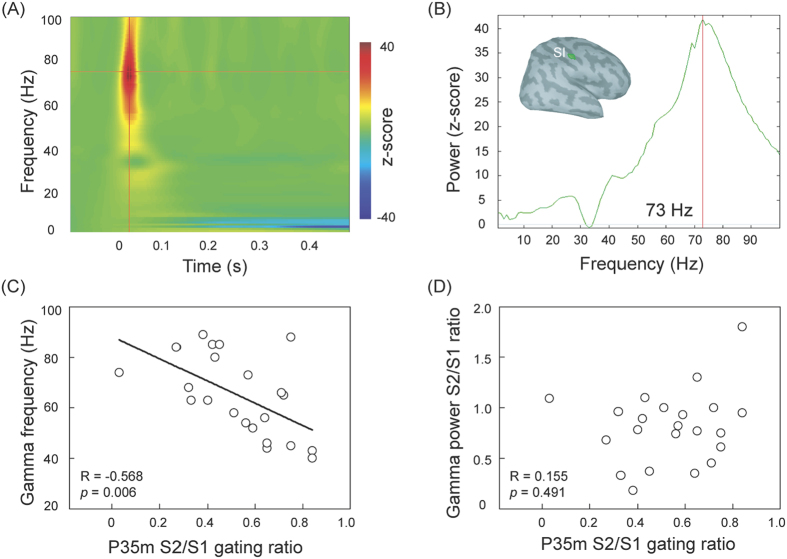
Figure 3.
(A) Time-frequency maps of the primary somatosensory cortex (SI) region in the representative subject. A robust oscillatory activity peaks round 20 to 30 ms after the stimulus onset. (B) The power spectrum is derived from (A). The peak frequency value of the maximal gamma power is around 73 Hz. (C) The scatter plot, with best-fit linear regression, shows that the individual peak gamma frequency is correlated with P35m gating ratio. (D) There is no significant association between P35m and gamma power S2/S1 gating ratios in the SI region.

