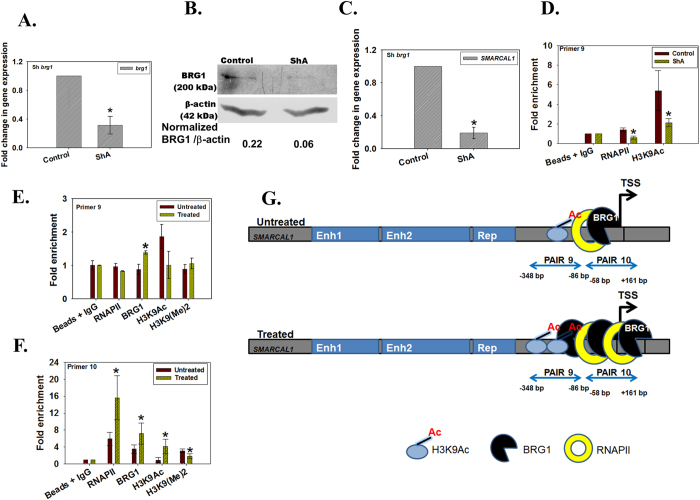
Figure 3. BRG1 positively regulates SMARCAL1.
(A) brg1 transcript levels were estimated by quantitative real-time RT-PCR in brg1 downregulated ShA clone. The difference was significant for all with p values < 0.05. (B) Western blot confirming the downregulation of BRG1 in ShA clone. (C) SMARCAL1 transcript levels were estimated by quantitative real-time RT-PCR in brg1 downregulated clones ShA. The difference was significant with p value < 0.05. (D) ChIP analysis was performed to determine the occupancy of RNAPII and H3K9Ac at SMARCAL1 promoter in brg1 downregulated ShA cells. The difference was significant for both RNAPII and H3K9Ac with p values < 0.05. (E) Occupancy of RNAPII, BRG1, H3K9Ac, H3K9(Me)2 on SMARCAL1 promoter was analyzed using primer pair 9 by quantitative real-time RT-PCR after treatment with 2 μM doxorubicin for 10 minutes. The difference was significant for all with p values < 0.05. (F) Occupancy of RNAPII, BRG1, H3K9Ac, H3K9(Me)2 on SMARCAL1 promoter was analyzed using primer pair 10 by quantitative real-time PCR after treatment with 2 μM doxorubicin for 10 minutes. The difference was significant for all with p values < 0.05. In all these experiments, GAPDH was used as the internal control. (G) Model explaining the regulation of SMARCAL1 by BRG1 when cells are treated with doxorubicin. The uncropped western blot is provided in Supplementary Fig. S12.

