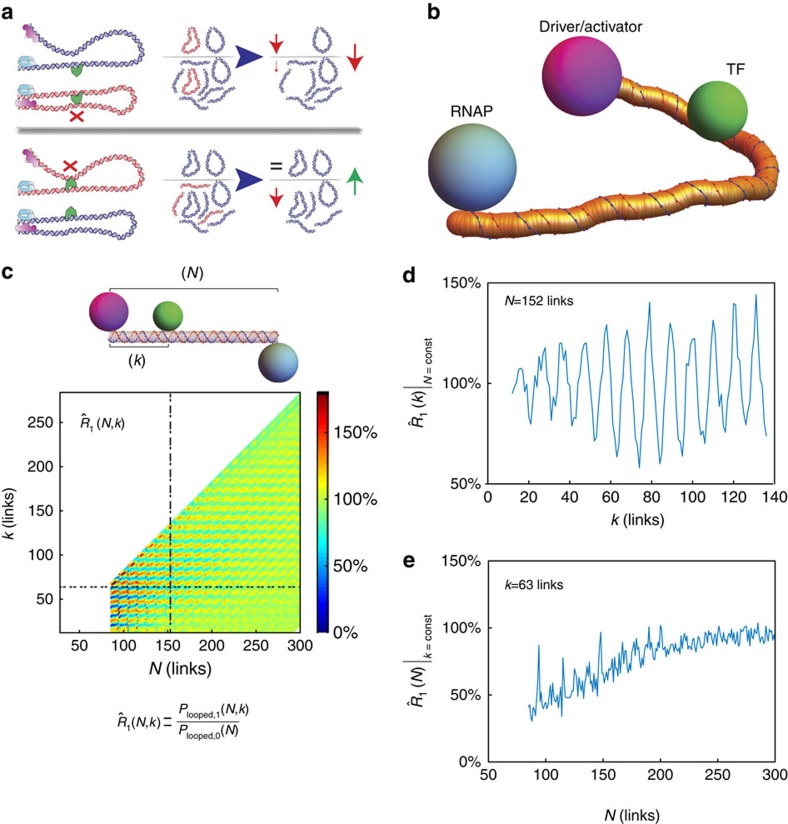
Figure 1. Transcriptional regulation via an excluded volume effect.
(a) Schematic representation of the looping probability ratio corresponding to the effects of a TF excluded volume on the probability of looping. We focus on two extreme binding configurations: first, the TF is positioned inside the loop ‘in-phase'; thus, its binding site will be separated from the activator's by an integer multiple of the helical repeat (∼n × 10.5 bp). Second, the TF is positioned outside of the loop or ‘out-of-phase' from the activator; thus, the binding site separation must be an odd integer multiple of half of the helical repeat (∼(n+1/2) × 10.5 bp). In the top schematic (a, top), the transcription factor bound ‘in-phase' excludes many of the looped configurations that were available to the polymer not bound by the TF. As a result, the propensity of the bound complex to loop should be reduced as compared with a complex not bound by the TF. This should lead to a repression regulatory effect. Conversely, the ‘out-of-phase' TF is positioned outside of the loop, which mainly results in the exclusion of previously available non-looped configurations. This results in a slight increase in the propensity of the TF bound complex to loop. Consequently, the out-of-phase configuration should yield a small upregulation or activation-like effect (a, bottom). Together, the ‘in-phase' and ‘out-of-phase' arrangements of the TF should generate a regulatory response that oscillates between down and upregulation as a function of the position of the TF within the loop. (b) Sample conformation of a thick chain with three protrusions generated using the self-avoiding WLC (SAWLC) algorithm. (c) Heat-map of the simulated looping probability ratio for a thick chain. Top: schematic with protrusions simulating a minimal enhancer with a single TF-binding site as a function of looping length (N) and TF protrusion position (k). The size of the TF protrusion was set to be 5.44 nm in diameter. Bottom: schematic showing the definition of the looping probability ratio. (d,e) One-dimensional cross-sections of the simulated probability ratio heat map at constant N=152 bp and k=64 bp, respectively.

