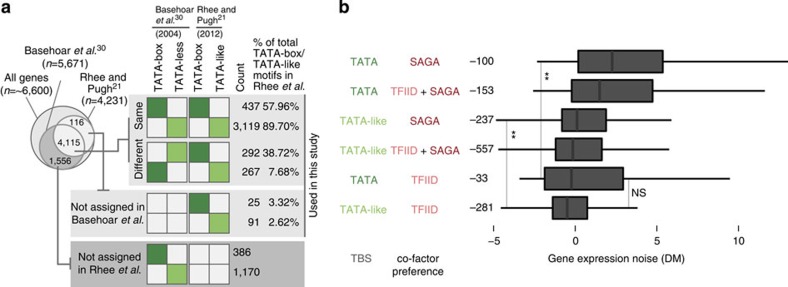
Figure 2. Comparison and classification of TBS sequences and the relationship between TBS type, co-activator binding preference and gene expression noise.
(a) Comparison of promoter classification using the computationally inferred TATA-box containing promoters by Basehoar et al.30 and nucleotide-level resolution measurement of TBP-binding sites by Rhee and Pugh21. The Venn diagram on the top left indicates the number of genes analysed in the different data sets and the extent of overlap of the genes studied, respectively. The matrix on the right indicates the degree to which the more recent data set from Rhee and Pugh agrees (top) and disagrees (bottom) with the assignment of genes in Basehoar et al.30 to host a TATA-box (dark green) or a TATA-like (light green) sequence/TBP-binding site (TBS) in their respective promoters. Genes with no assignment in both studies are also shown. (b) The relationship between promoter TBS type and co-activator preference, and gene expression noise. The respective distributions in terms of gene expression noise (DM) are shown as box plots and were ranked according to the median noise value of each class. In the different panels, statistical significances between distributions of medians were assessed using the Wilcoxon rank-sum tests that were corrected for multiple testing (‘**' for P<0.01 and ‘NS' for not significant). The number of genes in each class is given on the left of the plot.

