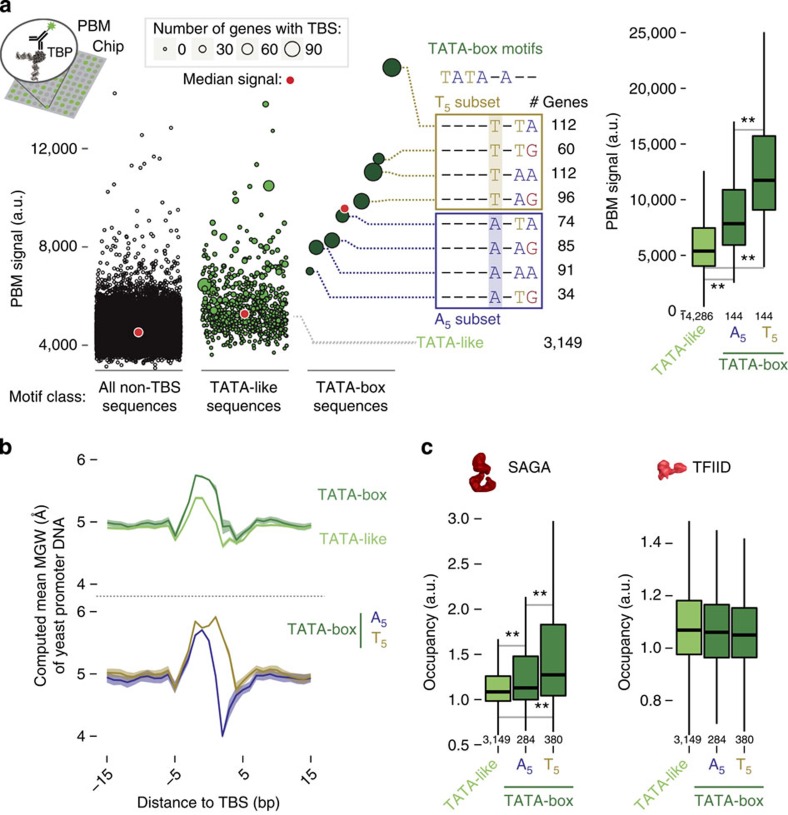
Figure 3. TBP binding affinity and intrinsic DNA flexibility of TBS sequences.
(a) The protein binding microarray (PBM) signal intensity is plotted for the different TBS type sequences (dark green for TATA-boxes and light green for TATA-like sequences) and all other 8-mer sequences (black). Every circle represents the median signal measured for all the repeats on the chip for that given sequence, and the size indicates the number of promoters in yeast that host this particular sequence in its TBS. The red dot indicates the median PBM signal per sequence class. PBM signals for TATA-box subtypes (middle), that is, T5 (yellow) and A5 (blue). The number of genes with the given sequence in the TBS in yeast is shown on the right. Box plots of distributions of PBM signal intensity for probes hosting the different TBS motifs (right). (b) Computed intrinsic minor groove width (MGW) for TATA-box (dark green) and TATA-like sequences (light green; top panel). The shaded area represents confidence intervals. MGW for T5 (yellow) and A5 (blue) subtypes are shown in the bottom. (c) Genes were classified based on the TBS type in their promoter (dark green for TATA-box with the T5 and the A5 subsets, light green for TATA-like sequences) and box plots of distributions for SAGA and TFIID occupancies are shown. In all the panels, Wilcoxon rank-sum tests (that were corrected for multiple testing; ‘**' for P<0.01) were performed to assess statistical significance between the medians of the distributions. The number of genes in each class is given on the bottom of the box plot.

