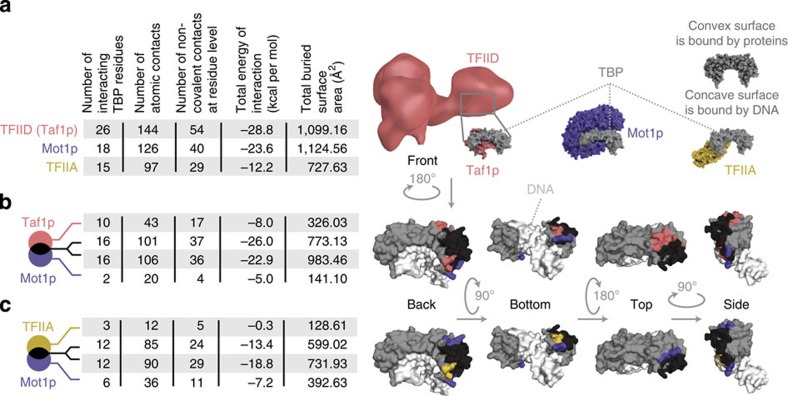
Figure 4. Properties of the interface and interactions between TBP and its partner proteins.
(a) Characterization of the interaction interface of TBP in complex with distinct PIC-influencing factors. TBP (grey) is shown from the same orientation as it interacts with TFIID (pink), Mot1p (purple) and TFIIA (yellow). For TFIID, the electron microscopy structure is shown. One of the subunits (Taf1p) with two TAND domains that interact with TBP is also highlighted. The properties calculated to characterize the interaction interface include the number of interacting TBP residues, the number of atomic contacts, the number of non-covalent contacts, the total computed energy of interaction (kcal per mol), and the total buried surface area (Å2). (b) Comparison of the TFIID(Taf1p):TBP interface and the Mot1p:TBP interface (convex TBP surface only). The contributions of the different factors are divided into those that are unique to each (pink for TFIID and purple for Mot1p) and those that are common/overlapping (black). (c) Comparison of the TFIIA:TBP interface and the Mot1p:TBP interface (convex TBP surface only). The contributions of the different factors are divided into those that are unique to each factor (yellow for TFIIA, purple for Mot1p) and those that are common/overlapping (black). In both (b,c) the interacting regions are mapped onto the structure and viewed from different angles. The DNA is coloured white.

