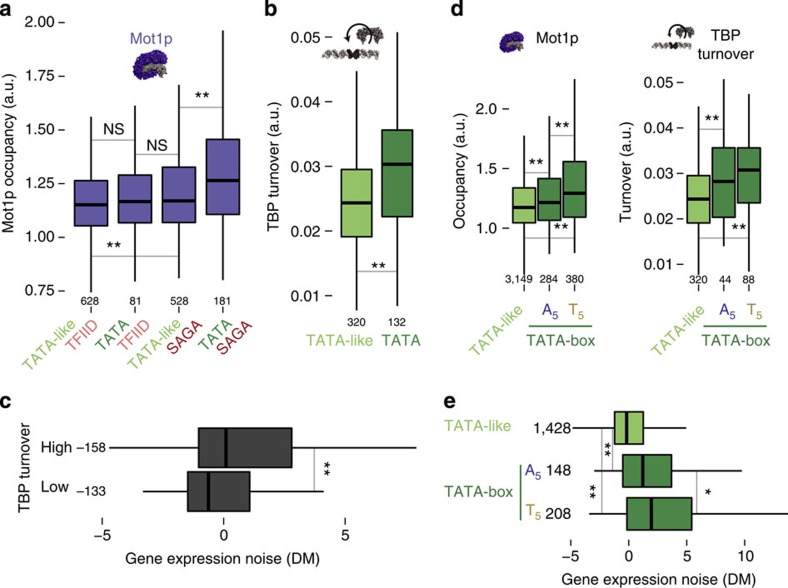
Figure 5. Box plots of the distributions highlighting the relationship between TBS, TBP interacting proteins, TBP turnover and gene expression noise.
(a) Mot1p occupancy at promoters with different TBS types and different co-activator regulation classes. (b) TBP turnover at promoters with different TBS types (dark green for TATA-box and light green for TATA-like). (c) The TBP turnover in promoters of genes was split into low and high bins ([0.008–0.026] and (0.026–0.051] a.u., respectively) based on the median TBP turnover and the distributions of gene expression noise for these two classes are displayed as box plots. Genes were classified based on the TBS type in their promoter (dark green for TATA-box with the T5 and the A5 subsets, light green for TATA-like sequences) and the distributions of Mot1p occupancy and TBP turnover are shown in (d) and noise in (e). In all the panels, Wilcoxon rank-sum tests (that were corrected for multiple testing; ‘**' for P<0.01, ‘*' for P<0.05) were performed to assess the statistical significance of the differences between the medians of the distributions. The number of genes in each class is given on the bottom or the left of the box plot.

