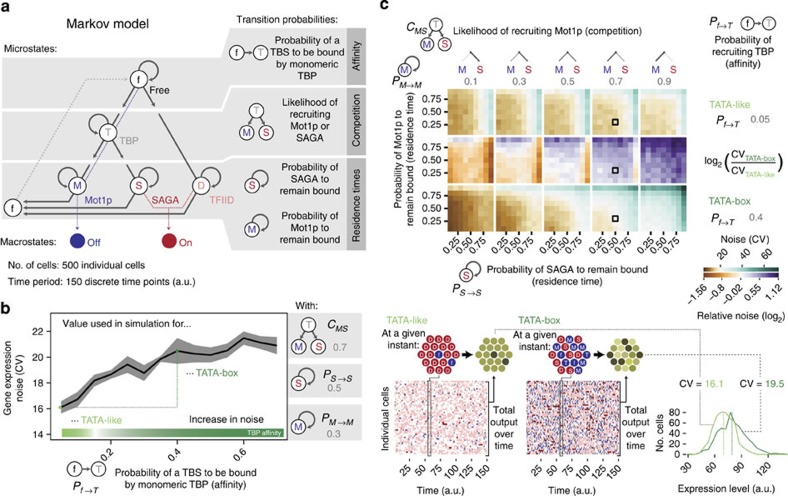
Figure 6. Stochastic simulations highlighting how TBP affinity for a TBS, competition between Mot1p and SAGA and their residence times influence noise.
(a) The possible TBP assemblies at the promoter (microstates) leading to transcriptional output (On state) or no output (Off state) and the transitions between the microstates were used to build a Markov model. The simulation was performed for a cell population with 500 individual cells and for 150 time points. (b) The intrinsic binding affinity of TBP for different TBS sequences and its relationship with noise. For this simulation, the competition and residence time parameters for Mot1p and SAGA were kept constant. The grey ribbon around the trend line indicates plus and minus one s.d. from the mean from three independent simulations. (c) Phase diagram of the possible noise behaviour for different parameters for a promoter under different co-activator and Mot1p regulation. Black square boxes in the matrix highlight the parameter combination that was used to generate the simulation results shown in b. In the bottom, the history of microstates from the simulation for a TATA-box and TATA-like promoters is shown (left). At a given instant, individual cells with TATA-like promoter have a more homogenous distribution of microstates and a corresponding consistent expression output. In contrast, cells with TATA-box promoters show a more heterogeneous distribution of microstates and a corresponding variable expression output (right). The respective mean expression values are indicated with a dashed line in the distribution.

