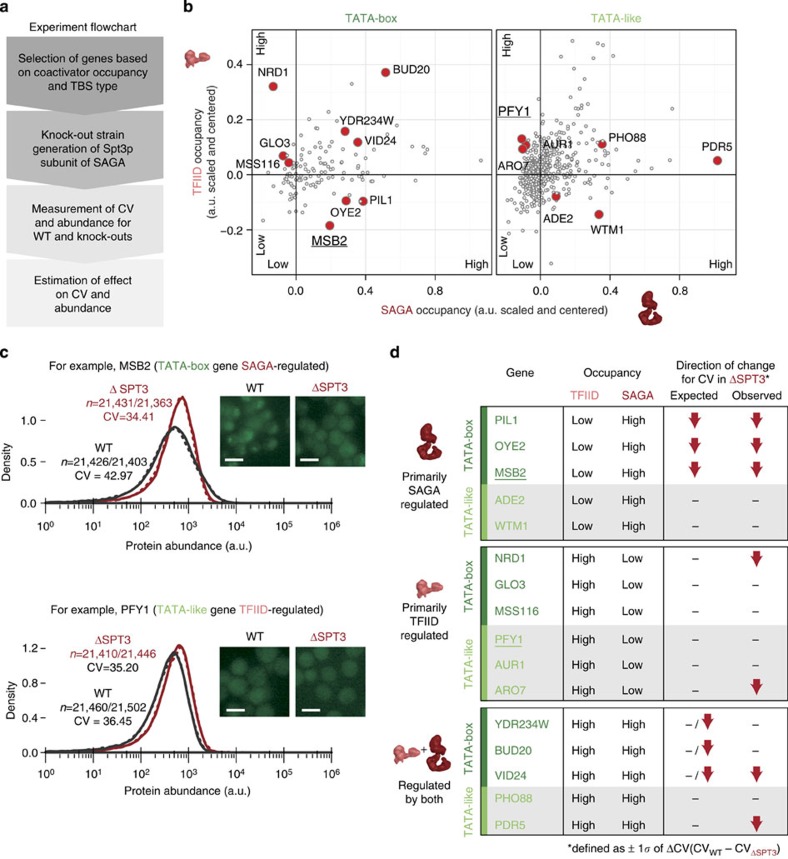
Figure 7. Deletion of SAGA impacts noise in the way predicted by the model.
(a) The experimental pipeline used in this study. (b) The genes were selected based on SAGA and TFIID occupancy for both TBS types (TATA-box containing, dark green and TATA-like sequence, light green). The selected genes can be classified into six groups with at least two genes in each group (total of 16 genes; red dots). (c) Fluorescence microscopy images of two genes (MSB2: TATA-box TBS and predominantly regulated by SAGA; PFY1: TATA-like TBS and predominantly regulated by TFIID), in the wild type (WT) strain and SAGA knockout strain (ΔSPT3; SPT3 of the SAGA complex interacts with TBP). Scale bars, 4.2μm. Flow cytometry measurements of thousands of single cells (∼20,000 cells; no. of cells, n are shown for both replicate experiments) were recorded with two replicates to get the distribution of expression levels in the population and to investigate the impact of the ΔSPT3 knockout on noise (CV). (d) Expected and observed effect of SPT3 knockout (SAGA subunit) for genes with different core promoter types. Genes are classified based on their TBS type (TATA-box, dark green and TATA-like, light green), and their respective TFIID and SAGA occupancy (high/low). The expected effects of the ΔSPT3 knockout based on the mechanistic model (no change; dash or a decrease in noise; red down arrow) are shown. The observed decrease in effect was defined as a deviation from WT noise levels by at least one s.d. from all measured differences.

