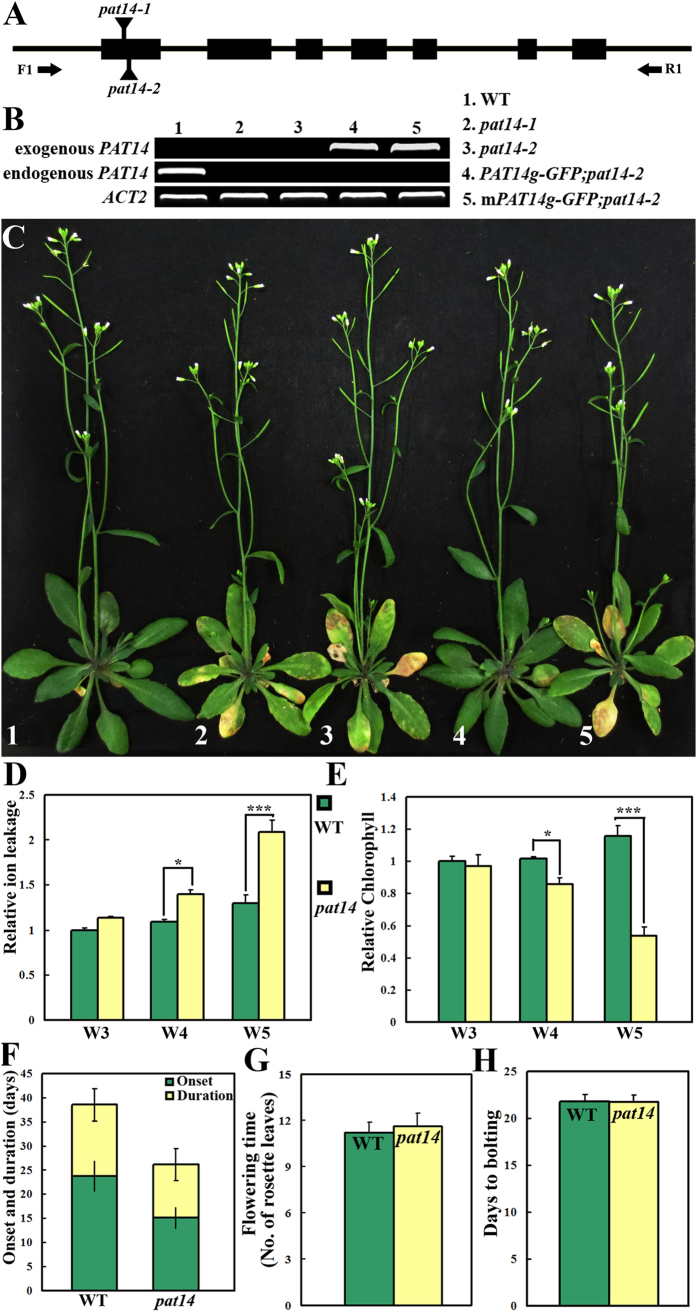
Figure 1. Functional loss of Arabidopsis PAT14 resulted in early senescence.
(A) Schematic illustration of the PAT14 genomic locus and the two T-DNA insertion sites. Arrows indicate primer binding sites for RT-PCR analyses. (B) Transcript analysis of PAT14 in wild type (WT), pat14-1, pat14-2, PAT14g-GFP in pat14-2 (PAT14g-GFP;pat14-2) and PAT14gC157S -GFP in pat14-2 (mPAT14g-GFP;pat14-2). ACT2, ACTIN2, was used as the internal control. (C) A representative plant at 40 days after germination (DAG) under long day (LD) condition from the corresponding genetic backgrounds shown in (B). (D,E) Electrolyte leakage (D) and relative chlorophyll contents (E) of wild type and pat14-2 at W3, W4, and W5 were measured by using the 4th pair of true leaves. Results are given as means ± standard deviation (SD), N = 30. * and *** indicate significant difference (Students’ t-test, P < 0.05 or P < 0.001 respectively). (F) Onset and progression of leaf senescence in LD-grown wild type and pat14-2. Green bars indicate days from leaf emergence to visible yellowing at the leaf tip (onset) while yellow bars indicate the time period (days) it takes from the first visible yellowing at the leaf tip to the leaf petiole (progression). The 4th pair of true leaves was chosen for this measurement. Results shown are given as means ± SD, N = 30. (G,H) Number of rosette leaves at floral transition (G) and number of days to bolting (H). Data were collected from 30 LD-grown plants for each genetic background. Results are given as means ± standard deviation (SD). No significant difference was detected (t-test, P > 0.05).

