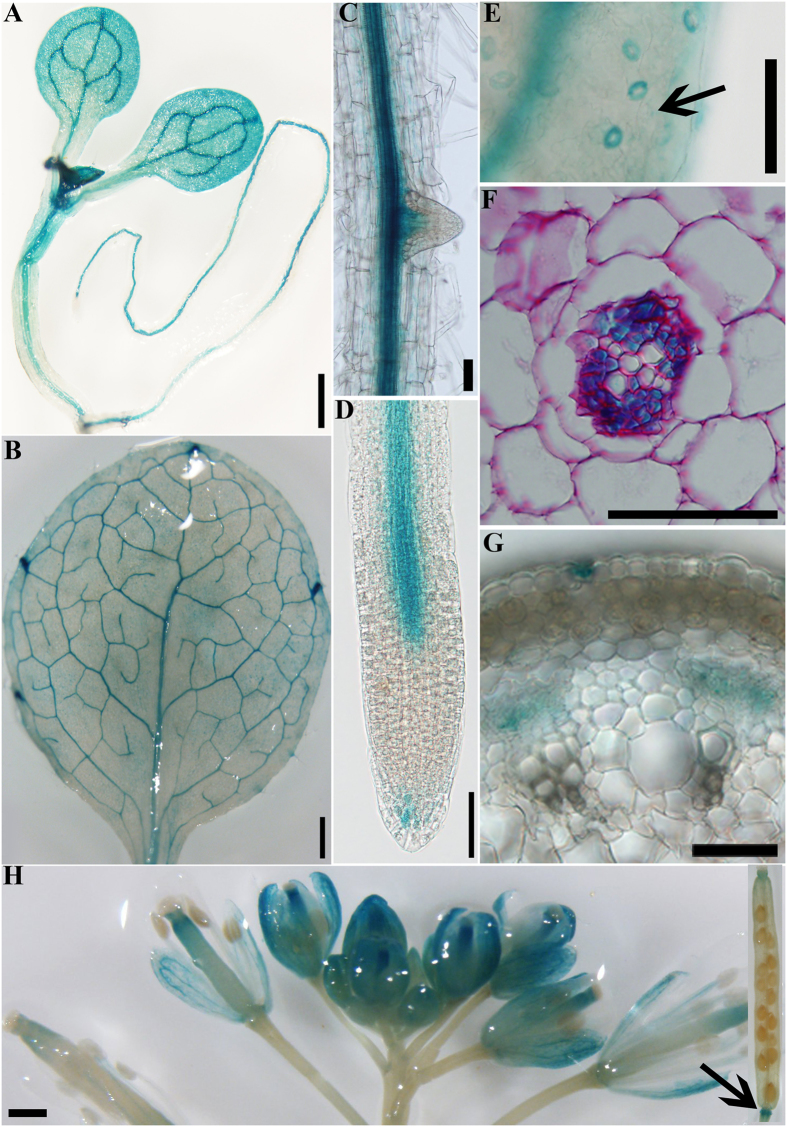
Figure 7. Expression of PAT14 by histochemical analyses of PAT14g-GUS; pat14-2 transgenic lines.
(A–H) GUS signals are detected in seedlings (A), leaves especially veins (B), root vascular tissues (C,D) and lateral root primordial (C), guard cells (E), phloem tissues in roots (F) and stems (G), inflorescence (H) and floral organ abscission zone (H arrow). In total, 26 individual transgenic lines were analyzed and representative expression patterns are shown. Bars = 500 μm for (A,B,E,H); 50 μm for (C,D,F,G).

