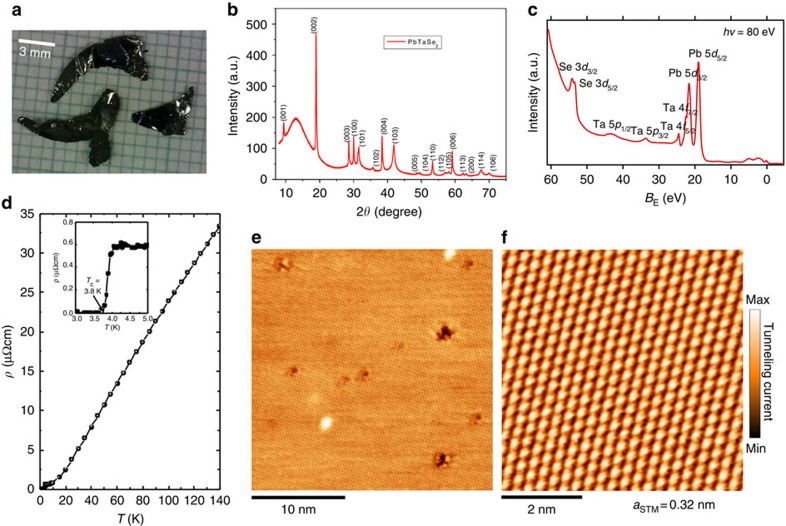
Figure 1. Overview of PbTaSe2 single crystal.
(a) Optical image of PbTaSe2 single crystals measured in this work. (b) X-ray diffraction measurements showing the lattice parameters matching with the space group (187)  . (c) ARPES core-level spectrum showing clear Pb-5d, Se-3d and Ta-4f core-level peaks. (d) Resistivity as a function of temperature showing a superconducting transition at 3.8 K. (e,f) STM topography of PbTaSe2, indicative of a surface lattice constant 3.2 Å.

