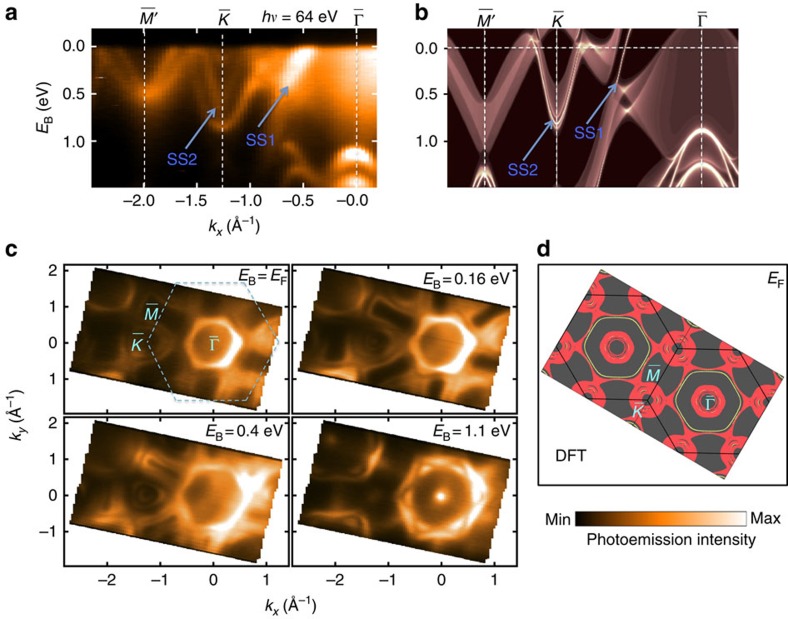
Figure 3. APRES mapping and band calculation of PbTaSe2.
(a) ARPES spectra taken along  −
− −
− with 64-eV photons. (b) DFT-projected bulk bands and surface bands (bright white lines) of (001) surface with Pb termination. (c) ARPES isoenergy concours taken with 64-eV photons. (d) DFT Fermi surface contour of PbTaSe2 (001) surface. The yellow lines indicate the surface states on Pb-terminated (001) surface.

