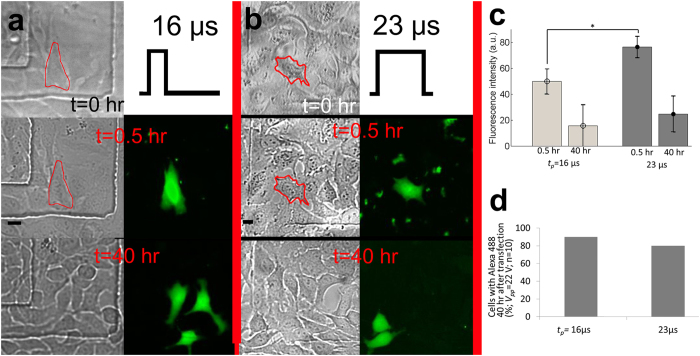
Figure 6. Intracellular delivery of 3 kDa dextran.
Intracellular delivery of 3 kDa dextran labeled with Alexa 488 using two different pulse durations (tp) of (a) 16 μs (n = 10) and (b) 23 μs (n = 10). The second and the third rows in A and B represent bright-field and fluorescence images of treated cells after 30 minutes and 40 hours after the treatment, respectively. Scale bars indicate 20 μm. Diffused green fluorescence from treated cells is observed, which indicates cytosolic staining of 3 kDa dextran labeled with Alexa 488. (c) Fluorescence intensity measurements of targeted single-cells 0.5 hr and 40 hr after the treatment. Asterisk (*) indicates statistically significant differences between the amount of delivered 3 kDa dextran into target cells, treated with different tp. Error bars indicate plus/minus one standard deviation. (d) 40 hours of cell tracking results after the acoustic-transfection. 90% and 80% of treated cells were alive and divided into daughter cells when tp was 16 μs and 22 μs, respectively (Supplementary Figures 7 and 8 for details).

