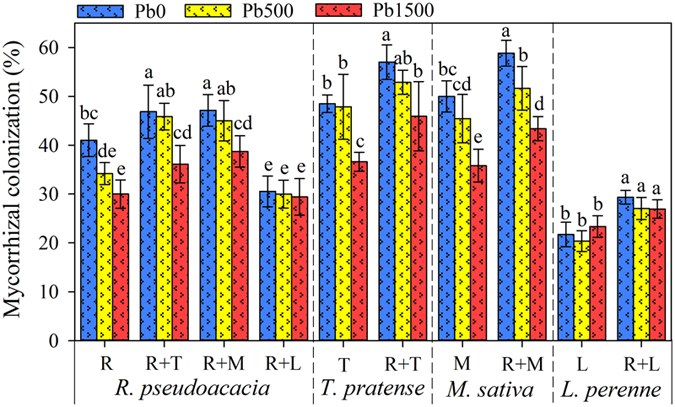
Figure 2. The mycorrhizal colonization (MC) of R. pseudoacacia, T. pretense, M. sativa and L. perenne was affected by Pb stress levels.

Pb0, Pb500 and Pb1500 represent Pb concentration of 0, 500 and 1500 mg kg−1, respectively. Monocultures of R. pseudoacacia, T. pretense, M. sativa and L. perenne are represented by R, T, M and L, respectively. The co-culture planting pattern is represented by the two co-culture species connected with the plus sign (+). The results are reported as the mean (n = 4) ± SD. Different letters indicate that significant differences were detected in the MC of each plant species grown in one planting pattern but at different Pb levels by Duncan’s multiple-range tests (P < 0.05).
