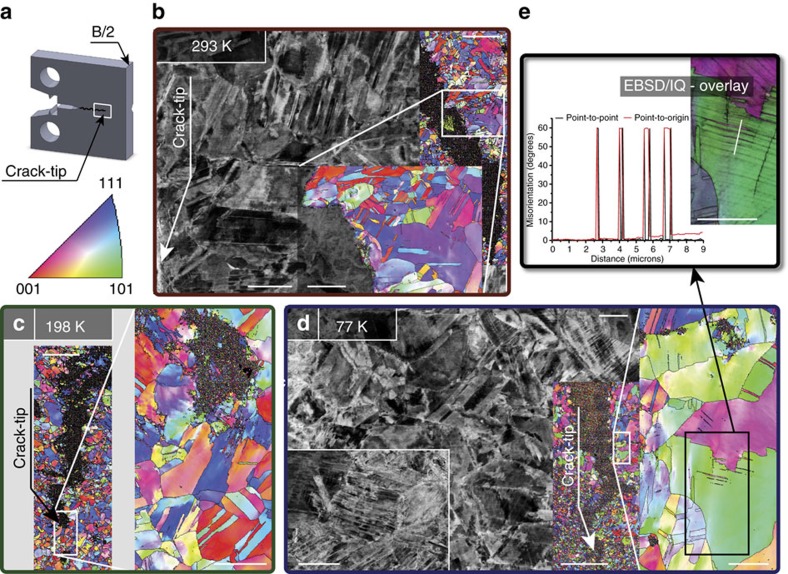
Figure 3. Deformation mechanisms in CrCoNi between 293 and 77 K.
(a) After testing, some samples were sliced in two along the half-thickness mid-plane, and the crack-tip regions in the centre of the samples (plane strain) were investigated in the scanning electron microscope using back-scattered electrons (BSE) and electron-backscatter diffraction (EBSD). (b) EBSD scans in the wake of the propagated crack of a sample tested at room temperature show a few recrystallization twins and grain misorientations indicative of dislocation plasticity whereas BSE scans reveal cell formation and nano-twinning as additional deformation mechanism. (c) Similar to room temperature behaviour, EBSD scans of samples tested at 198 K show recrystallization twins and misorientations indicative of dislocation plasticity ahead of the propagated crack-tip. (d) Samples tested at 77 K show pronounced nano-twinning and the formation of dislocation cells (BSE), whereas EBSD scans reveal dislocation plasticity in the form of grain misorientations, some recrystallization twins and deformation induced nano-twins. (e) An arbitrarily chosen path on an EBSD image overlaid on an image quality (IQ) map shows 60° misorientations typical for the character of such deformation twins. (The IQ map measures the quality of the collected EBSD patterns and is often used to visualize microstructural features.) The scale bars of the BSE image, the EBSD image and the inset of the EBSD image in b are 5, 75 and 25 μm, respectively; the ones of the EBSD image and its inset in c are 50 and 10 μm, respectively. The BSE image and its corresponding inset, and the EBSD image and its inset have scale bars of 10, 5, 200 and 15 μm, respectively. The scale bar in e is 15 μm.

