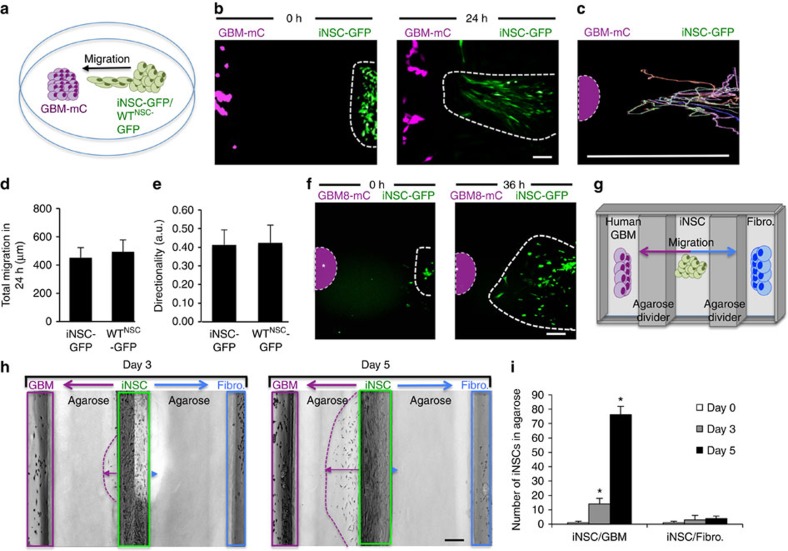
Figure 3. Engineered iNSCs home to GBM.
(a) Outline of the iNSC migration assay. iNSC-GFPFLs were seeded 500 μm apart from mCherry+ human GBM cells and placed in a fluorescence incubator microscope. Time-lapse fluorescent images were captured every 10 min for 36 h and used to construct movies that revealed the migration of iNSCs in real time. (b) Summary images showing the migration of iNSC-GFPFL (green) towards U87-mC-FL (magenta) at 0 and 24 h after plating. (c) Single-cell tracings depicting the path of multiple iNSC-GFPFL migrating towards GBM cells over 24 h. Asterisk and dotted line indicate the site of GBM seeding. (d,e) Summary graph showing the total distance that iNSCs and brain-derived WTNSC migrated towards GBM cells (d), and directionality of iNSC-GFPFL and WTNSC migration to human U87 GBMs (e) determined from the real-time motion analysis. (f) Representative images showing the migration of iNSC-GFPFL to co-cultured patient-derived GBM8-mC cells (indicated by the dotted lines) at 0 and 36 h after plating. Asterisk and dotted line indicate the site of GBM8 seeding. (g–i) Outline of agarose migration assays used to determine the selectivity of iNSC migration (g). Three wells were created in six-well culture plates containing agarose. iNSCs were seeded in the middle well, and GBM or fibroblasts were seeded in wells on either side. Real-time imaging (h) and summary data (i) show the number of iNSCs that migrated towards the wells containing GBM cells or the fibroblasts. Scale bars in b,f,h, 100 μm. Scale bar in c, 500 μm. Data are mean±s.e.m. Data in d,e,i are from three independent experiments. In d,e, P>0.05 by Student's t-test. In i, *P<0.05 by one-way ANOVA with Tukey's multiple comparisons test.

