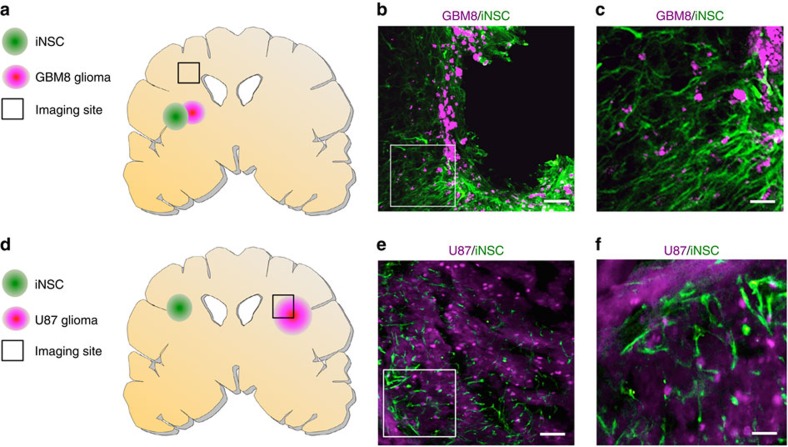
Figure 4. In vivo migration of iNSCs to GBMs.
(a–c) To assess iNSC tracking of invading GBM cells, GBM8-mCs were implanted into the brains of mice (n=7). Three days later, iNSC-GFPFLs were implanted into the tumour. Twenty-one days later, fluorescent images of cryosections were captured 1.5 mm away (indicated by the square, a). (b,c) Representative fluorescent images showing the colocalization of iNSC-GFPFL (green) with invading GBM8-mC (magenta; b), and elongated iNSC morphology (c). (d–f) To assess the migration of iNSCs to distant established GBMs, mCherry+ U87 were implanted into the parenchyma of mice (n=7). iNSC-GFPFLs were implanted into the contralateral hemisphere 5 days later. Immunofluorescent analysis of post-mortem tissue sections 21 days post implant was used to determine the presence of GFP+ iNSCs (green) at the mCherry+ GBMs (magenta; square indicates site of imaging). Scale bars in b,e, 100 and 30 μm in c,f. Data are mean±s.e.m.

