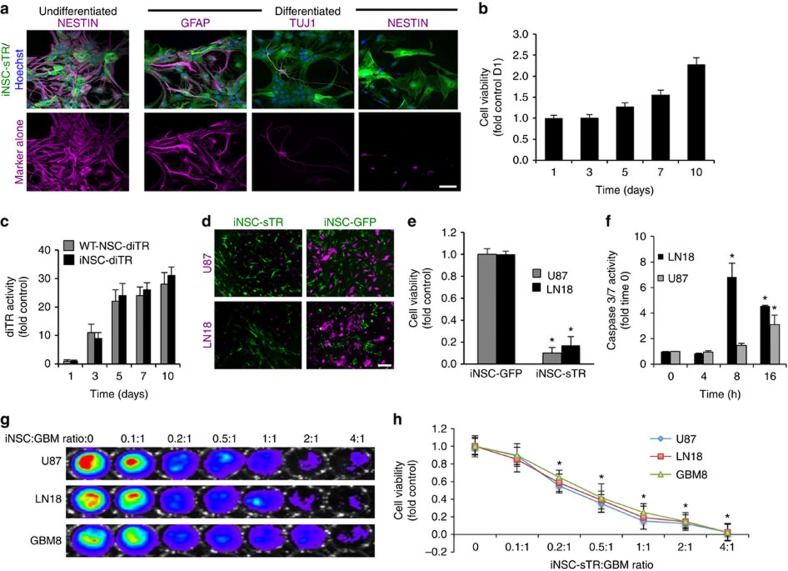
Figure 5. The antitumour efficacy of iNSC-sTR treatment of GBM cell lines in vitro.
(a) Representative images showing the expression of nestin, GFAP or Tuj-1 in undifferentiated and differentiated iNSC-sTR cells with IHC staining (iNSC-sTR=green; staining=magenta). Magenta images alone show only the fluorescent channel corresponding to nestin, GFAP and Tuj-1 staining. (b) Summary graph showing the viability of iNSC-sTR over 10 days determined using bioluminescence assays. (c) Summary data showing the levels of diTR released by iNSC-diTR or WTNSC-diTR cells determined with luciferase imaging on media samples. At each time point, equal volumes of media were collected from WTNSC-diTR or iNSC-diTR, combined with coelenterazine, and bioluminescence imaging was performed to determine the levels of secreted diTR. (d,e) Representative images (d) and summary graph (e) showing the cell viability of U87 and LN18 human GBM cells co-cultured with iNSC-sTR or iNSC-GFP assessed using luciferase-based assay. (f) Summary graphs showing caspase-3/7 activity in U87 and LN18 GBM cells treated with sTR or control conditioned media determined using a bioluminescence assays that incorporates a proluminescent caspase-3/7 substrate. (g,h) Representative bioluminescence imaging (g) and summary data (h) showing the viability of U87, LN18 and GBM8 tumour cells cultured with increasing numbers of iNSC-sTR. Scale bar in a, 20 and 50 μm in d. Data are mean±s.e.m. Data in b,c,e,f,h are from three to four independent experiments. In b, P>0.05 by one-way ANOVA. In c, P>0.05 by repeated measures two-way ANOVA. In e, *P<0.05 by Student's t-test. In f,h, *P<0.05 by repeated measures two-way ANOVA.

