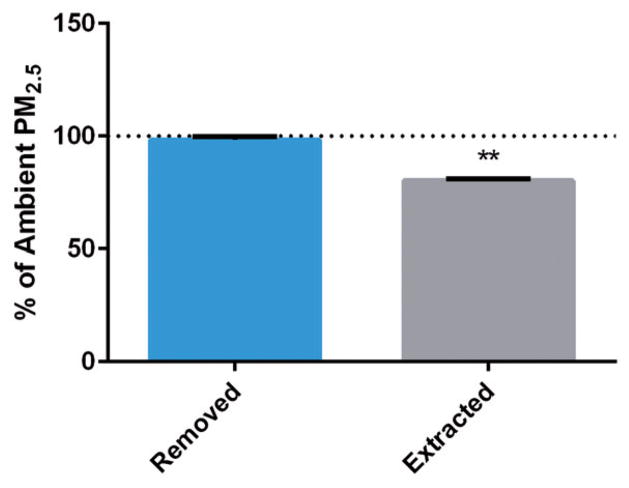
Figure 3.
PM2.5 mass following removal and extraction. Mass following removal of PM2.5 from filter via sonication and following complete extraction (concentration and re-suspension in cell media) are displayed relative to total ambient PM2.5 mass for all sampling locations (n=5). Data are expressed as means±SD; **p value <0.001 indicating a statistically significant difference between groups.

