
Figure 1. The GWAS “inflection point”: discoveries in relation to sample size.
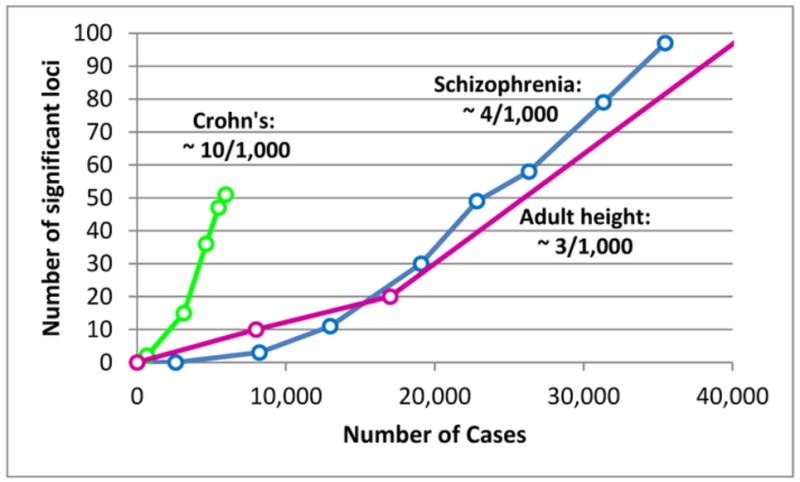
Each point represents the number of independent chromosomal regions (loci) containing SNPs associated with the disease or trait at a genome-wide level of significance in a GWAS analysis with a given number of cases (and a control group of similar or greater size). The curve for adult height is truncated but the next datapoint is 180 loci with the equivalent of ~65,000 cases. The data points are results of unpublished meta-analyses carried out by S.R. on roughly chronological subsets of each dataset in order to demonstrate the linear relationship between sample size and discoveries once a minimum N (“inflection point”) has been achieved. The ratios for each trait are the approximate number of discoveries per 1,000 additional cases (plus controls). Each ratio results from a combination of the number of susceptibility loci for the trait and the size of their genetic effects. Large Ns would discover additional loci for each trait. (See Figure S1 for references.)