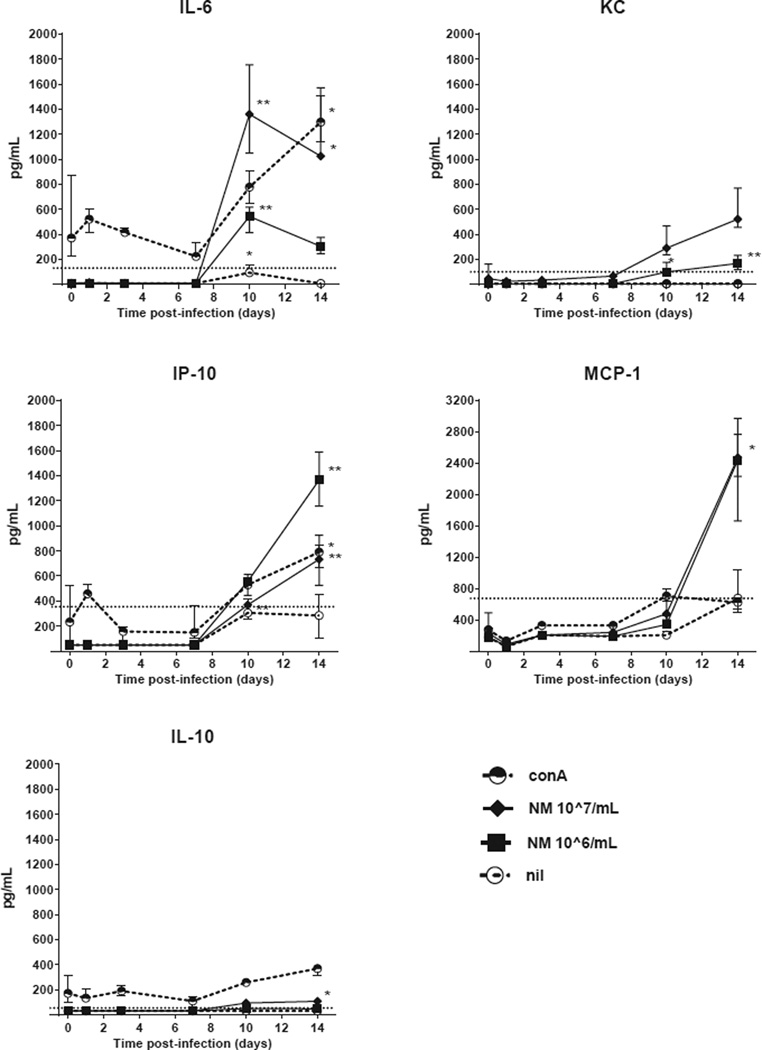
Figure 5. Early IL-6, KC, MCP-1, IP-10 and IL-10 production by stimulated splenocytes of C. burnetii-infected immunocompetent BALB/c mice.
Splenocytes were stimulated for 48h with either conA [2.5 µg/mL], NM phase I [10^7/mL] or [10^6/mL], or left unstimulated (nil). The median ± IQR cytokine production is shown per time point of four pairs of infected mice. T=0 shows the median ± IQR of five pairs of uninfected mice. IL-1β and TNF-α production were below the lowest detection limit at all time points for all stimulations (not shown).The dashed horizontal line represents the lowest standard in the Luminex assay, values below are extrapolated. P values were calculated by Kruskal-Wallis test followed by Dunn’s multiple comparison test comparing cytokine concentrations of infected mice at different time points with uninfected mice. * P<0.05, ** P<0.01.
Abbreviations: conA, concanavalin A; NMI, C. burnetii Nine Mile phase I.

