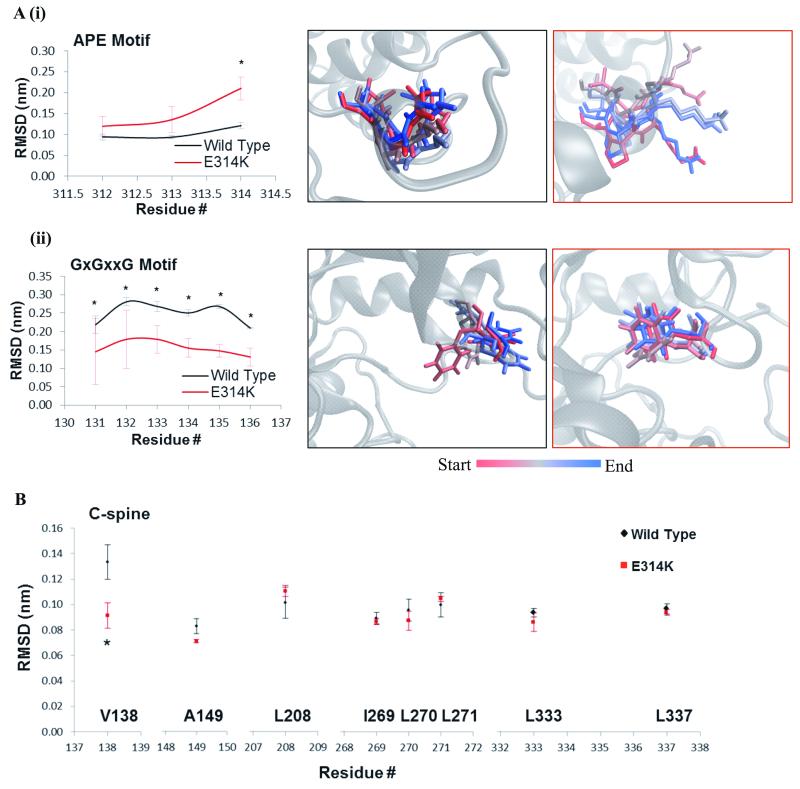
Figure 2.
Structural analysis of MLK4-E314K mutant. A, Time lapse images show movements within the APE motif (i) and GxGxxG motif (ii) of MLK4-E314K (red) and WT (black) over the course of the simulation. Movement determined by the average RMSD for each residue within these structures. Values are representative of three independent simulations. Error bars indicate ±SEM, * p<0.05. B, Graph shows the average movement observed for each residue of the C-spine during the course of the simulations of MLK4-E314K (red) compared to MLK4-WT (black). Data is the average of three independent repeats, error bars show ±SEM, * p<0.05.

