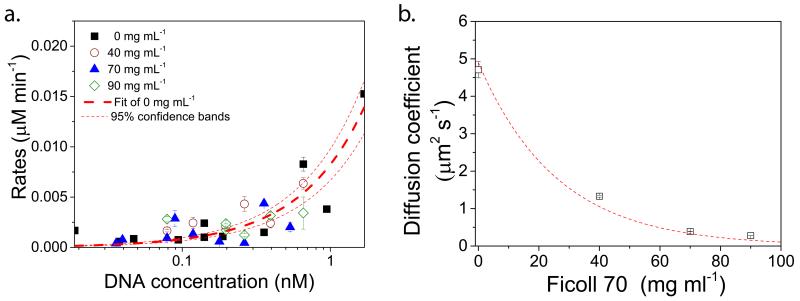
Figure 4. Protein expression rates and ribosomal diffusion coefficients.
a, CFP expression rates for 0, 40, 70 and 90 mg mL−1 with linear fit for 0 mg mL−1 showing 95% confidence bands. b, Diffusion coefficients of ribosomes over a range of Ficoll concentrations determined using fluorescence recovery after photo bleaching experiments. The dashed line is a Stokes-Einstein fit of the diffusion coefficient D ~ 1/μ, with μ the concentration-dependent dynamic viscosity of Ficoll (Supplementary methods).

