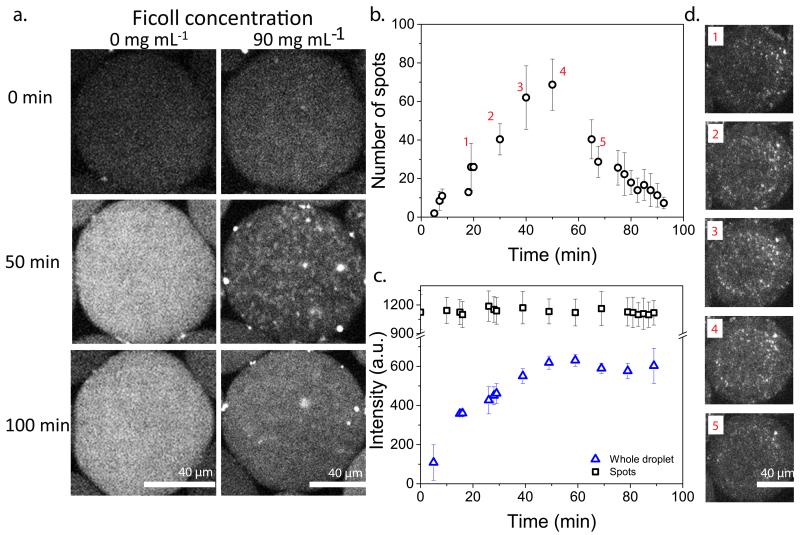
Figure 5. Inhomogeneous distribution of mRNA over one droplet at high Ficoll concentrations.
a, In vitro transcription only experiments with 0.6 nM pET-32×BT showing mRNA expression with 0 mg mL−1 (left) and 90 mg mL−1 (right) of Ficoll, in the presence of molecular beacon (MB) b, Average number of spots over time from three separate droplets (circles) with error bars showing standard deviations. c, Average fluorescence intensity over time of the detected spots (squares) and the whole droplets (triangles). Error bars are standard deviations of three separate droplets. d, Representative fluorescence images corresponding to the labelled time points in b.

