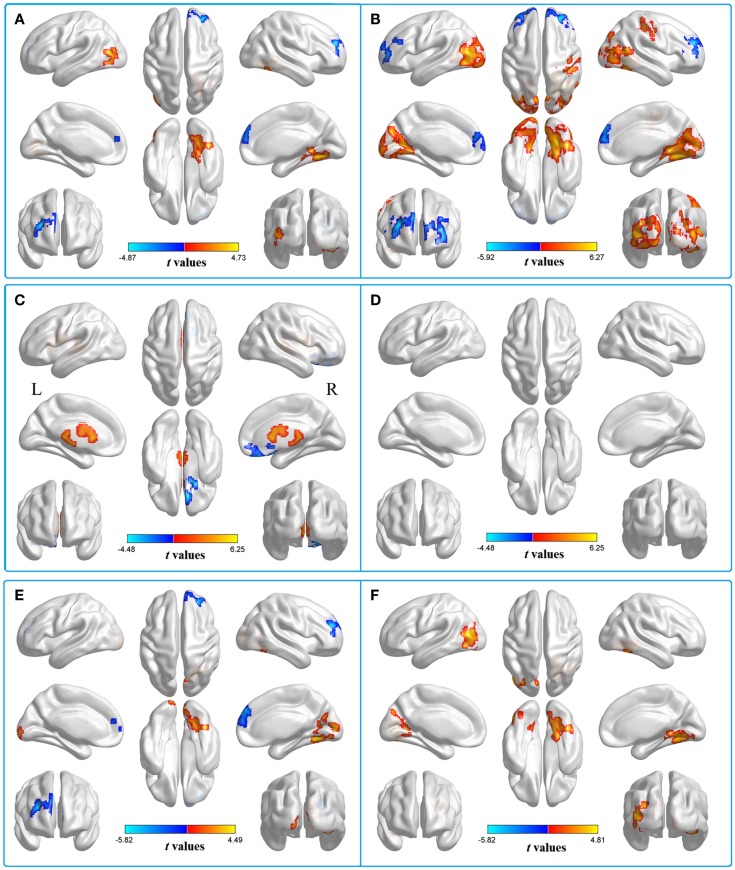
Figure 2.
Two-sample t-test for the (A) typical band (0.01–0.08 Hz) voxel-level p < 0.01 and cluster-level p < 0.05, GRF corrected. Cool color indicates that the mTBI group had decreased ALFF compared with the controls and the hot color indicates the opposite. Main effects of (B) group. Hot color represents higher ALFF in the mTBI group than in the control group, whereas cool color represents lower ALFF in the mTBI group. Main effects of (C) frequency band. Hot color represents higher ALFF in the slow-4 band than in the slow-5 band, while cool color represents the opposite. The results were obtained by a 2 × 2 ANOVA. (D) Interaction between frequency bands and groups. Two-sample t-test for the (E) slow-4 band (0.027–0.073 Hz) and (F) slow-5 band (0.01–0.027 Hz), voxel-level p < 0.01 and cluster-level p < 0.05, GRF corrected. Cool color indicates that the mTBI group had decreased ALFF compared with the controls and the hot color indicates the opposite.

