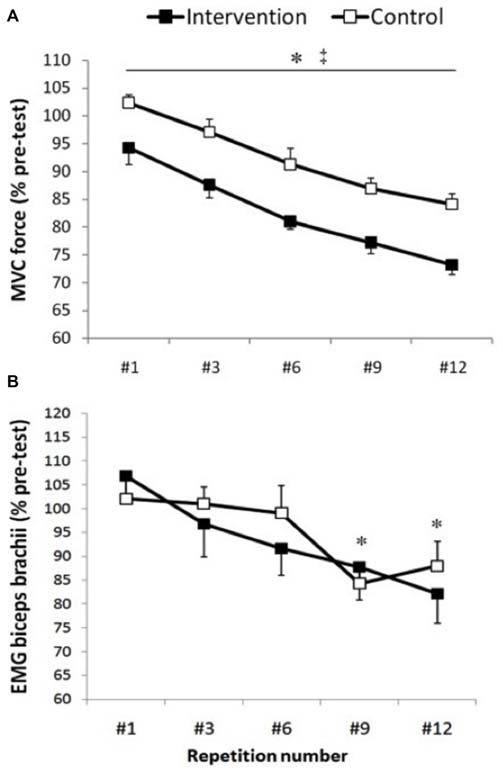
Figure 2.

Maximal voluntary contractions (MVC) force and biceps brachii electromyographic (EMG). Group data are expressed as means ± SE and normalized to pre-test. (A) Arm MVC force normalized to pre-test. ‡Indicates that MVC force was significantly lower in the intervention condition compared with control condition (p < 0.001). *Indicates that MVC force significantly and progressively decreases from repetition #1 until repetition #12 (p < 0.001). (B) EMG activity of the biceps brachii muscle measured 50 ms before motor evoked potentials (MEPs). *Indicates that biceps brachii EMG activity was significantly lower at repetition #9 and #12 compared with repetition #1, #3 and #6 (p < 0.04).
