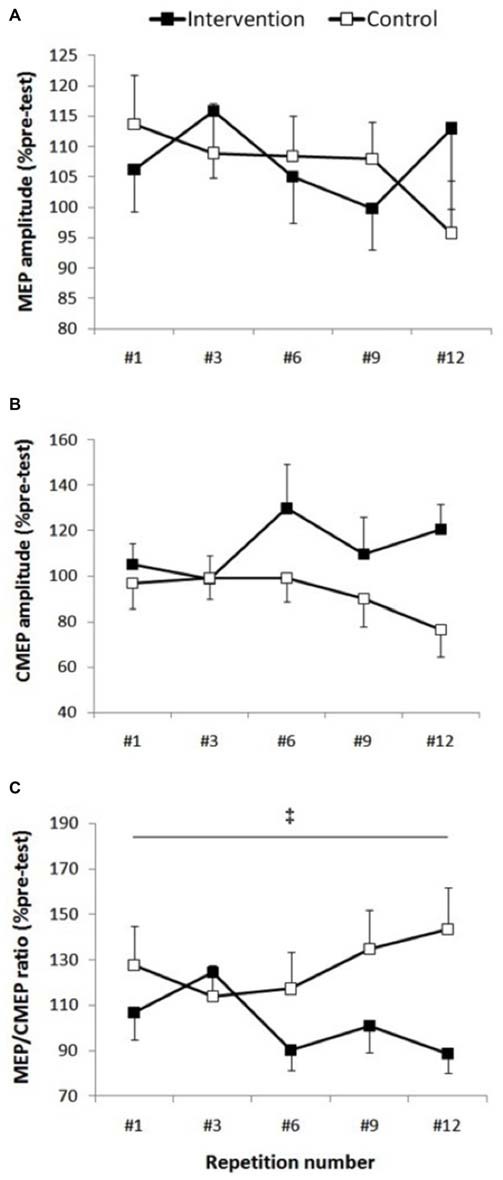
Figure 3.

Corticospinal excitability. Group data are expressed as means ± SE and normalized to pre-test. (A) MEP/M-max normalized to pre-test did not show any condition, repetition or interaction effect (p > 0.47). (B) There was a trend toward higher cervicomedullary MEP (CMEP) amplitude in the intervention session (p = 0.08), however there wasn’t any repetition or interaction effect (p > 0.29). (C) ‡Indicates that MEP/CMEP ratio was significantly smaller in the intervention condition compared with control condition (p = 0.042).
