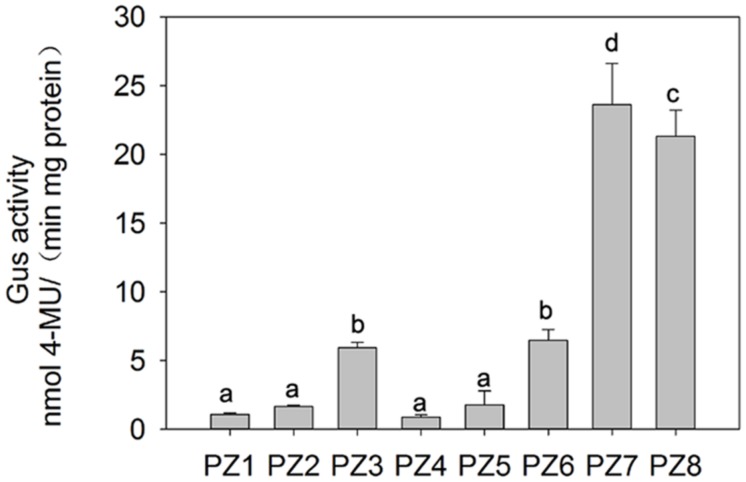
FIGURE 3.
Fluorometric GUS assays of PZ1–PZ8 transgenic tobacco plants. The values are the mean ± standard deviation from three independent transgenic lines and each line five individual plants for each construct. Different lowercase letters above the bars indicate significant differences at P < 0.05.

