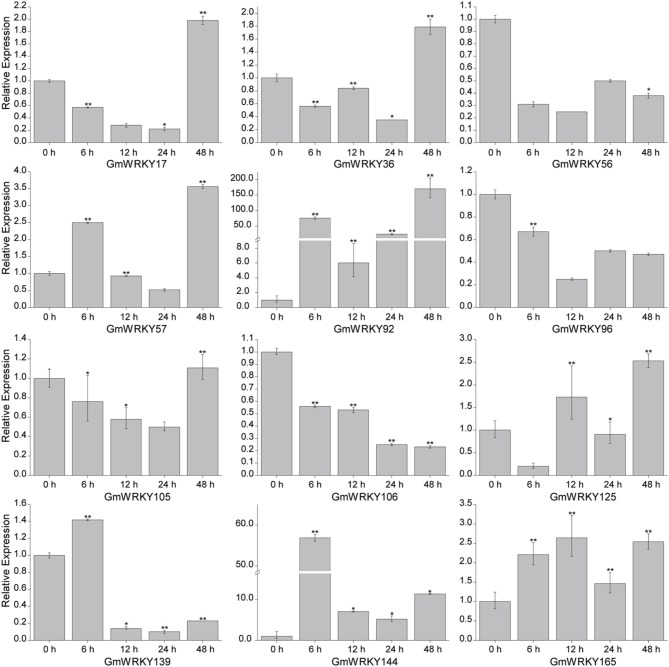
Figure 11.
Expression pattern of selected GmWRKY genes under salt stress. The Y-axis indicates the relative expression; X-axis (0, 6, 12, 24, and 48 h) indicates hours of salt treatment. The standard errors are plotted using vertical lines. *significant difference at P < 0.05, **significant difference (P < 0.01).

