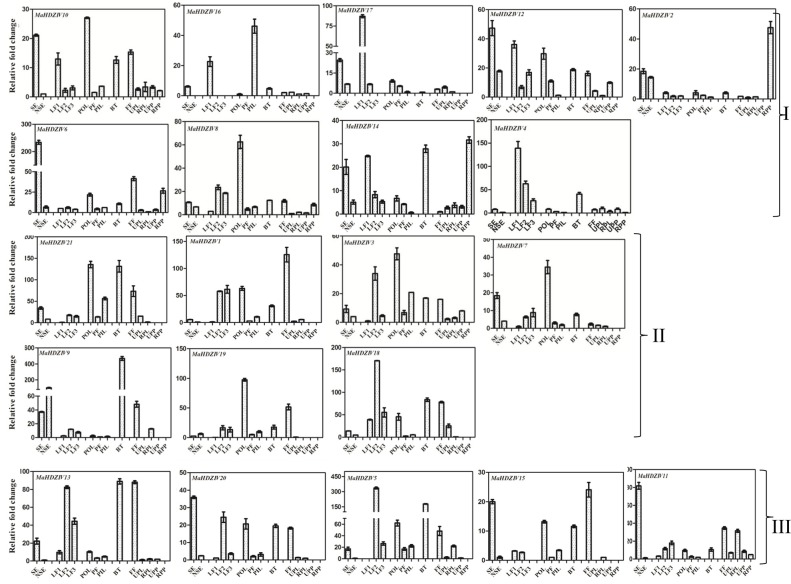
Figure 6.
Expression analysis of banana HDZIV genes in different tissues. The different tissues are BT, Bract; FF, Fruit fingers; LF1, Leaf development stage 1; LF2, Leaf development stage 2; LF3, Leaf development stage 3; NSE, Non embryogenic callus; PIL, Pseudostem inner most tissue; PF, Pseudostem middle fibrous layer; POL, Pseudostem outer layer; RPL, Ripe banana peel; RPP, Ripe banana pulp; SE, Somatic embryo; UPL, Unripe banana peel; and UPP, Unripe banana pulp. In each case, expression level is expressed as relative fold change as compared to the tissue with the lowest expression level. The graphs are arranged as per the grouping in phylogentic tree.

