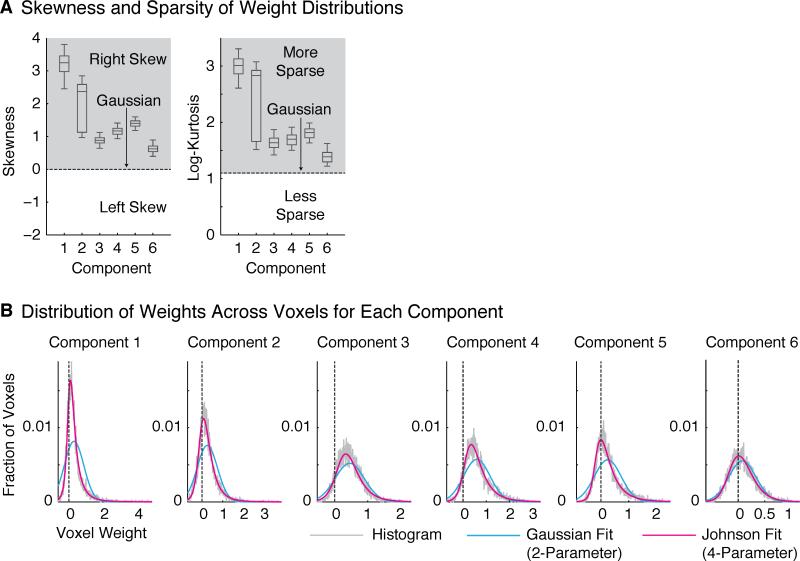
Figure 7. Statistical Properties of Component Voxel Weights.
(A) Skewness and log-kurtosis (a measure of sparsity) for each component. All components were skewed and sparse relative to a Gaussian. Box-and-whisker plots show the central 50% (boxes) and central 96% (whiskers) of the distribution for each statistic (via bootstrapping across subjects).
(B) Histograms of voxel weights for each component (gray). Weight distributions were fit using a Gaussian distribution (blue) as well as a modified Gaussian (“Johnson”) distribution with flexible skew and kurtosis (magenta). For all components, the Johnson distribution fit the measured voxel weights significantly better than the Gaussian (see Figure S7 for another test of non-Gaussianity). Fits were evaluated using left-out data.

