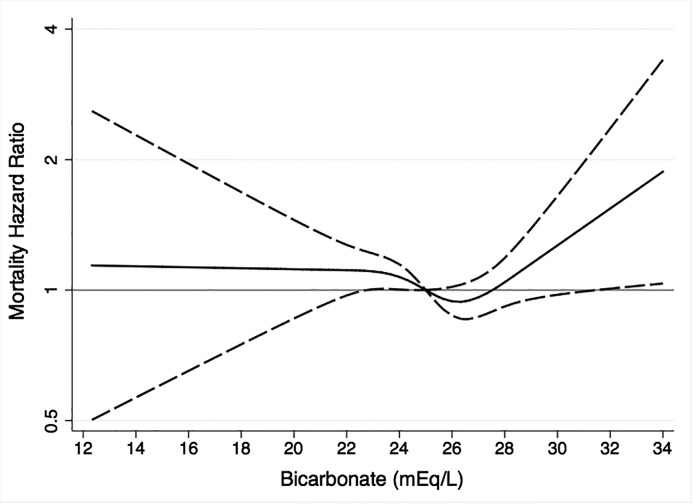
Figure 2.
Cubic spline regression analysis of the relationship between serum bicarbonate and mortality. Adjusted for age, sex, race, clinical site, eGFR, urinary albumin-to-creatinine ratio, chronic obstructive pulmonary disease, smoking, and pH. The line represents the hazard ratio point estimate, and the dashed lines represent the 95% confidence limits. Serum bicarbonate concentration of 25 mEq/L was the reference.

