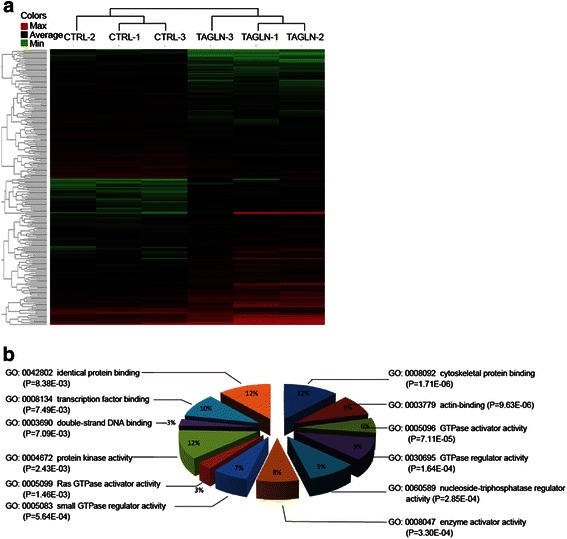
Fig. 4.

Effects of TAGLN overexpression on other genes. Gene expression profiling was performed using the Affymetrix platform. a. Hierarchical clustering analysis of 256 genes that show significant expression differences (P < 0.05) and a minimum 2-fold change between RKOTAGLN and RKOCTRL cells. Color represents relative gene expression on a log-transformed scale. b. Gene Ontology analysis for genes in Panel a
