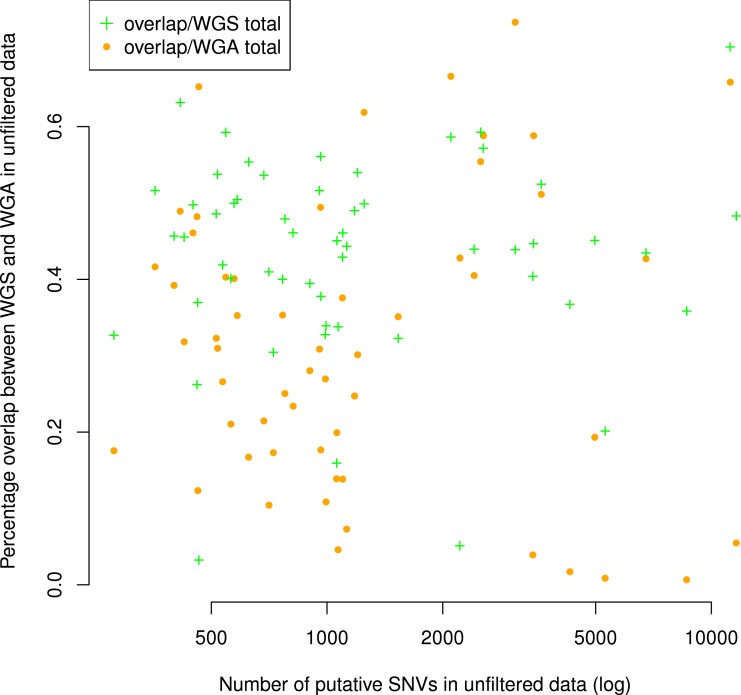
Figure 3. Number of putative SNVs per sample does not correlate with the number of putative SNVs recoverable in both replicates.
The percentage of putative SNVs in a given sample that are in the overlap between replicates is not correlated to the number of mutations in that sample (Spearman ρ = 0.05, S = 29268, P = 0.68). We calculated the percent overlap in two ways: with reference to the total number of putative SNVs in the WGS sample (green) and with reference to the total number of putative SNVs in the WGA sample (orange). The correlation was calculated with respect to WGA.

