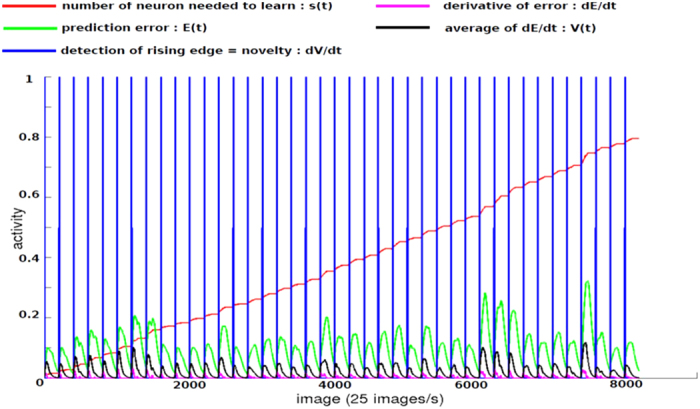
Figure 3. Neural network (N.N.) activities during the learning phase in experiment 1.

The number of neurons needed to learn from the Visual Features N.N. (red); Prediction Error E(t) from the novelty detector N.N. (green); derivative of error prediction dE/dt (dark pink); average of dE/dt (black); novelty detection in the Person Recognition N.N. (dark blue); each hit corresponds to the detection of a novel interactive partner.
