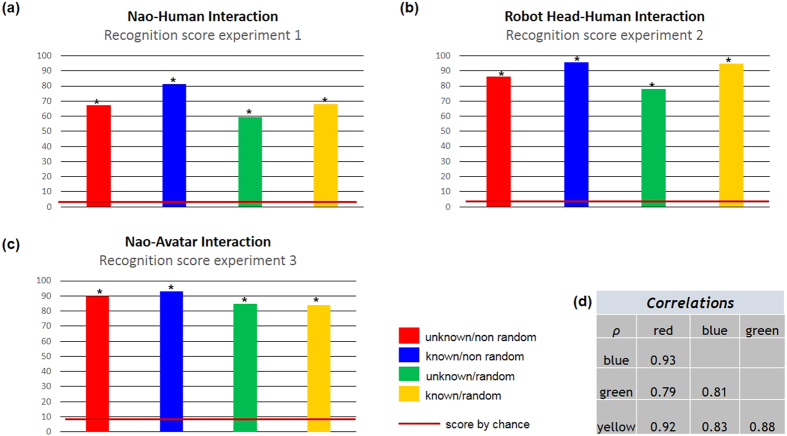
Figure 4. Main results.
Mean recognition scores from Experiment 1 (a), Experiment 2 (b), Experiment 3 (c) in unknown/non random (red); known/non random (blue); unknown/random (green); known/random (yellow) conditions. *p < 0.001, comparisons between mean recognition scores and chance were provided by binomial test. (d) Correlation matrix between recognition scores from Experiment 1 are shown in the table (red indicates unknown/non random condition and so on).

