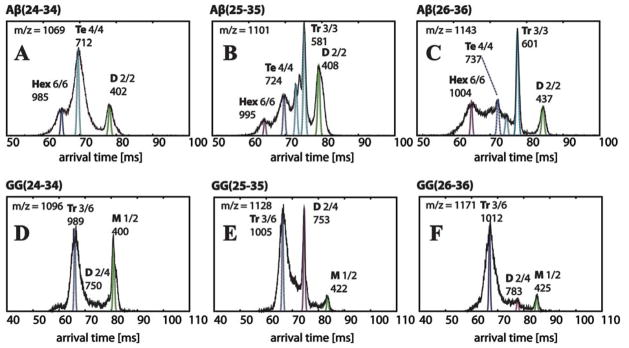
Figure 3.
Representative arrival time distributions (ATDs) of the natural charge state (one charge per monomer) peaks of Aβ(24-34), Aβ(25-35), Aβ(26-36) and their GG versions obtained from instrument I. Each feature is labeled with oligomer size (M = monomer, D = dimer, Tr = trimer, Te = tetramer, Hex = hexamer), n/z ratio and experimental cross section σ in Å2. The peptide concentration is 100 μM. The narrow dashed lines are the peak shapes predicted for a single conformer of the cross sections given in the Figure. The ATD features are broader than the predicted shape for a single conformer, suggesting there are multiple families of structures with similar cross sections. The cross sections listed above the peaks and in Table 2 correspond to these dotted line peaks.

