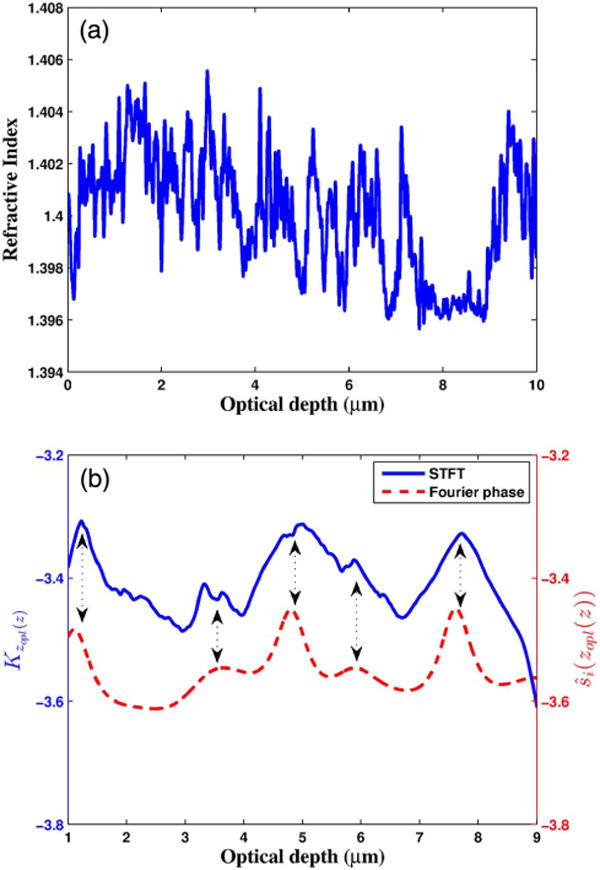
Fig. 15.

(a) Refractive index profile mapped to the optical-space, and (b) Fourier phase and STFT-based estimates of the axial mean spatial frequency profile corresponding to the refractive index profile. Both are expressed in the log-scale. The optical depth range is limited to (1μm, 9μm) to avoid simulation-based boundary artifacts.
