
Fig. 3.
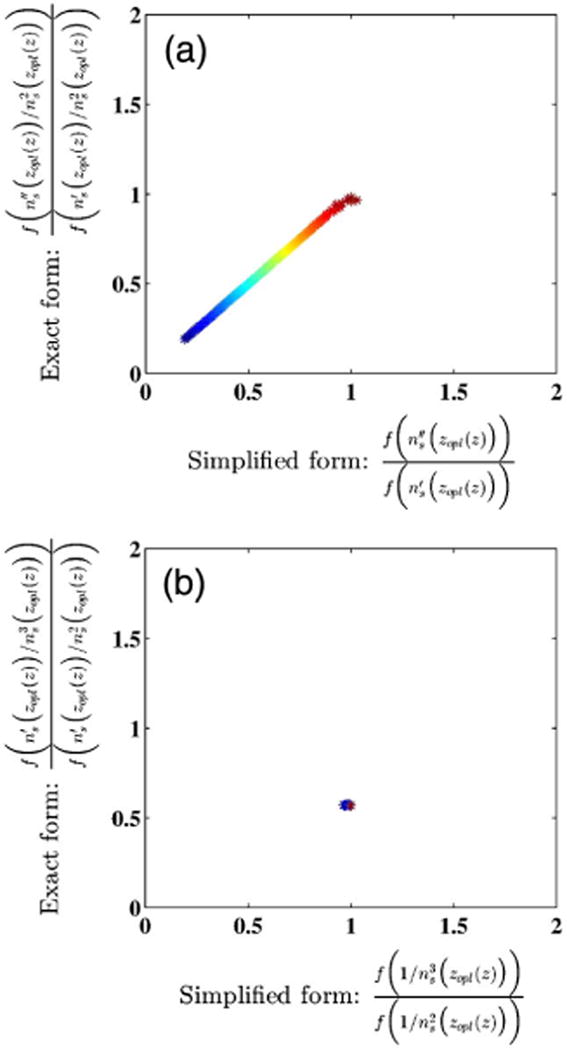
Correlating the behavior of the exact and simplified forms of each term in Eq. (25) at optical depth zopl(z) = 4 μm, using the refractive index model defined in [Eq. (26)]. The parameters of the refractive index model are n0 = 1.4, Δn = 0.01, and s ranging from −3 to −2.3 in the log-scale, indicating a slowly varying refractive index profile. (a) Normalized scatter plot of the first term of Eq. (25) along the y-axis and its simplification along the x-axis. The normalization factor for both axes is 1.019 × 10⁷ m−1. (b) Normalized scatter plot of the second term of Eq. (25) along the y-axis and its simplification along the x-axis. The normalization factor for both axes is 0.0025 m−1.