
Fig. 9.
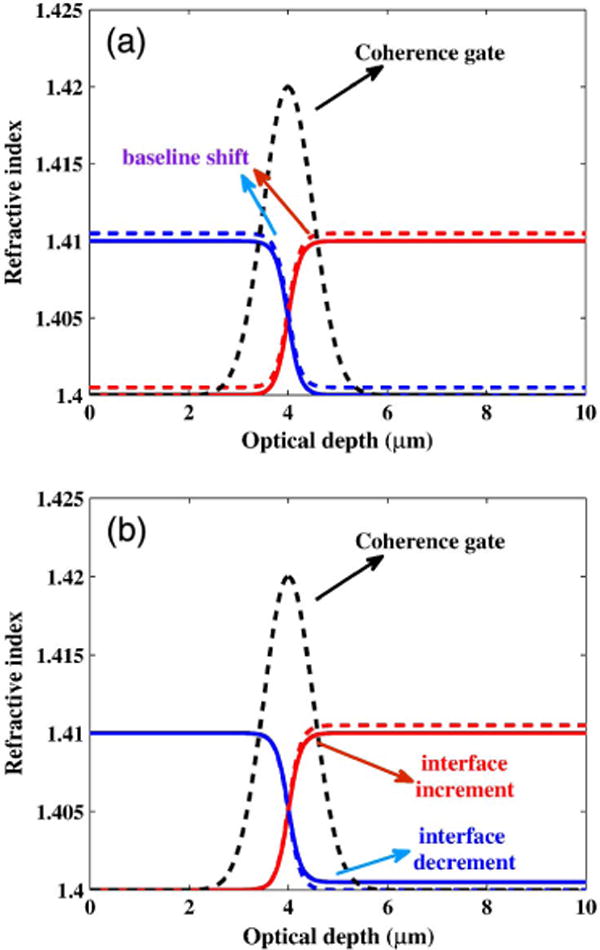
Behavior of the refractive index profile within the coherence gate in addition to those shown in Fig. 2. (a) Baseline shift (indicated by solid and dashed lines) for increasing (red) and decreasing (blue) refractive index profiles. (b) Interface increment (indicated by solid and dashed lines) for increasing (red) and decreasing (blue) refractive index profiles.