
Figure.
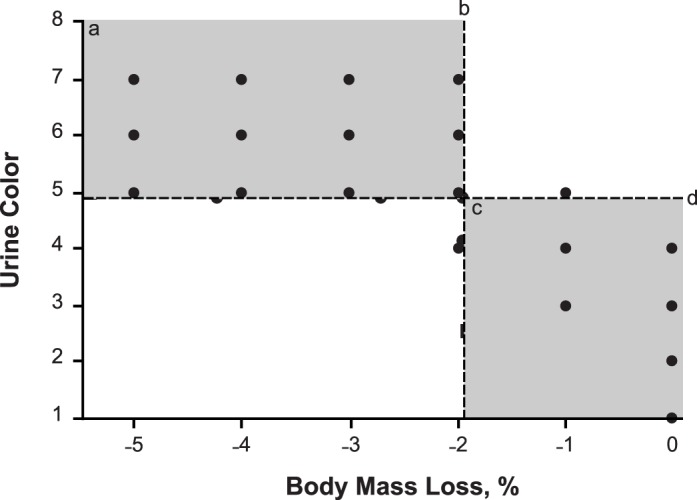
Relationship between urine color test outcome and percentage of body mass loss (BML). a The shaded area denotes true positive results. b The vertical line denotes the division between a hypohydrated state (≥2% BML) and a euhydrated state (<2% BML). c The shaded area denotes true negative results. d The horizontal line denotes the receiver operating characteristic curve analysis-specified criterion value for detecting ≥2% BML.