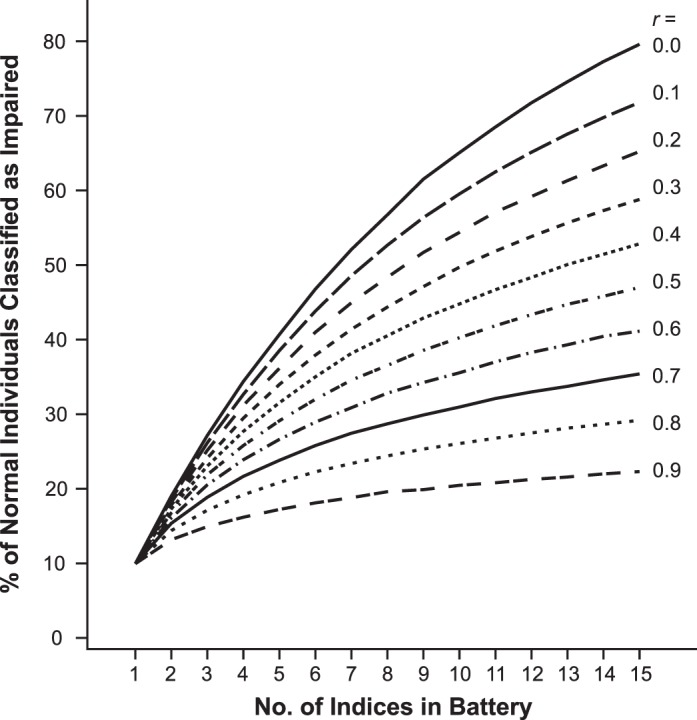
Figure 2. .

Expected percentage of normal, healthy individuals with 1 or more impaired indices by number of indices and their intercorrelations (using a z = −1.282 cutoff for impairment, akin to an 80% confidence interval). The r value presented on the right side of each line denotes the correlation between the indices (reliable change indices) in each simulated data set.
