Figure 3.
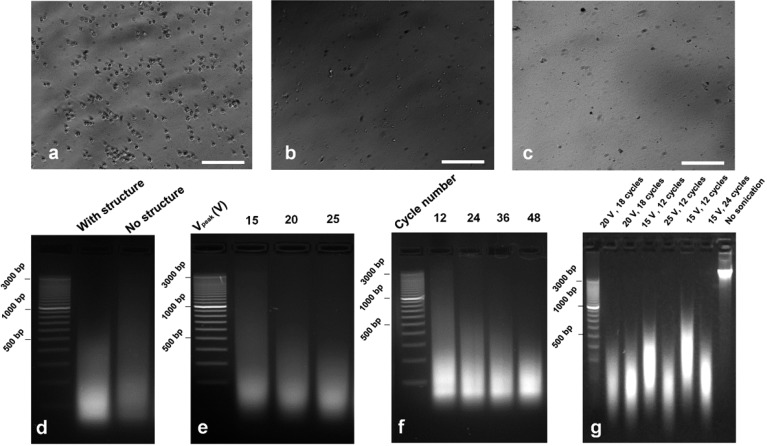
Chromatin/gDNA fragmentation by on-chip sonication. Sonication was conducted under sine-wave 61 kHz AC with a sonication time of 3 s in each 10 s cycle. (a–c) Microscopic images of cross-linked GM12878 cells before and after sonication. Scale bar is 100 μm. (a) Before sonication. (b) Sonication for 6 cycles with Vpeak of 20 V. (c) Sonication for 12 cycles with Vpeak of 20 V. (d–f) Gel electrophoresis of DNA fragments after chromatin fragmentation (starting from 50,000 cross-linked cells in each experiment). (d) Chromatin fragmentation is stronger with crescent structures than without them in the microfluidic chamber under the same sonication conditions (30 cycles, Vpeak = 20 V). (e) Chromatin fragmentation increases with higher Vpeak. Thirty cycles were applied for each sample. (f) Chromatin fragmentation increases with higher number of sonication cycles (12–48 cycles). Vpeak was 20 V for all the samples. (g) gDNA fragmentation under various sonication conditions measured by gel electrophoresis (Vpeak of 15–25 V, 12–24 cycles); 200 ng of genomic DNA was used in each experiment.

