Fig. 1.
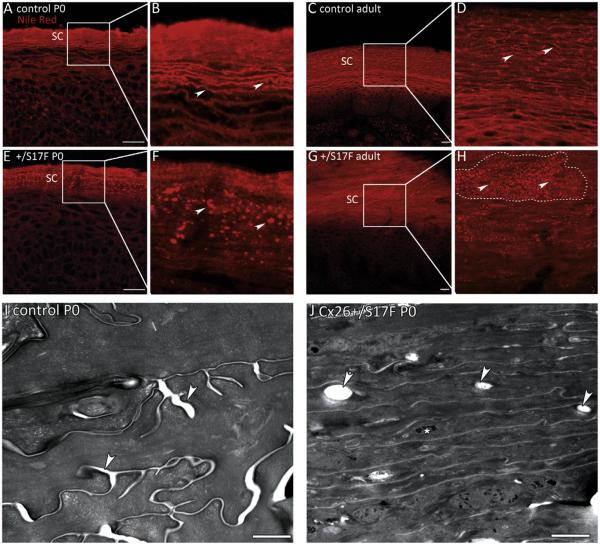
Lipid distribution in the epidermis. (A–D) Nile red stainings of paw epidermis of newborn (A, B) and adult (C, D) control mice. Examples of the evenly distributed lipid lamellae of the stratum corneum are indicated by arrows in B and D. (E–H) In newborn (E, F) and adult (G, H) Cx26S17F mice the lipids accumulate in a dot-like pattern in the stratum corneum (arrows). The stratum corneum of adult mice is strongly thickened leading to fields of “lipid-dots” (surrounded by a dashed line in H). SC: stratum corneum. Scale bars: 20 μm. (I–J) Electron micrographs of stratum corneum of paws. (I) The stratum corneum of control mice shows lipid lamellae in between the corneocytes (arrows). (J) In Cx26S17F mice the stratum corneum appears more compact than control stratum corneum. There are lipid inclusions inside the corneocytes (arrows). Additionally, aggregates of non-processed keratohyalin can be observed (asterisk). Scale bars: 1 μm.

